General information and entertainment, not investment advice. The author is not a SEBI-registered adviser or research analyst. No recommendation, no promised returns. Markets carry risk including loss of capital. Figures may not be current. Consult a registered adviser before acting.
1. At a Glance
Kamdhenu closed FY26 with a peculiar tension: revenue rose just 2% to ₹763 crore, but net profit jumped 29% to ₹78 crore. The stock trades at 9x P/E against a peer median of 22x. The franchise royalty model is executing—₹175 crore in FY26, up 25% year-on-year—while own manufacturing volumes remain flat. The company holds ₹27.8 crore cash against nil debt.
The worry signal: sales growth at 2% sits below a 10-year CAGR of 5%. The opportunity: management has already raised royalty rates and plans 10–15% annual increases. ROCE expanded to 29.4%, the highest in the peer band. A balance sheet with nothing to hide, a multiple with everything to prove.
2. Introduction
Kamdhenu was incorporated in 1994 and went public via IPO in 2006. The company manufactures and markets TMT steel bars, structural steel, and colour-coated sheets. Its backbone is a franchise network: 100+ franchisees produce under the Kamdhenu brand, paying royalty on each tonne sold. This model—asset-light brand plus distribution moat—sits at the core of everything that follows.
The steel industry in India has been cyclical and competitive for decades. TMT bars face pressure from both organised players (Tata Steel, Jindal, APL Apollo) and unorganised production. Kamdhenu’s edge is a 20% share of the organised retail branded segment, supported by 12,500+ dealers and 250+ distributors. In FY26, franchisee volumes scaled to 37.9 lakh MT (up 10% YoY), while own manufacturing stayed flat at 1.21 lakh MT.
3. Business Model: WTF Do They Even Do?
Kamdhenu is a brand-and-distribution play in disguise. The company owns one steel manufacturing facility in Bhiwadi, Rajasthan, with capacity of 1.25 lakh MTPA. It reinvests profits into R&D, training, and marketing. But 80%+ of its profit now flows from royalties—a per-tonne fixed fee charged to franchisees who produce steel under the Kamdhenu name.
The franchise network operates across TMT bars (40 lakh MTPA capacity), structural steel (10 lakh MTPA), and colour-coated sheets (2.5 lakh MTPA). Regional distribution is uneven: North accounts for 31% of installed capacity, East 35%, West 19%, and South just 15%—a white space. Management flagged South India as a priority for new unit expansion.
The model’s voltage is that royalty income is insulated from raw material volatility. While billet prices move 30–40% year-on-year, Kamdhenu’s royalty is ₹435 per MT (FY26), a fixed fee that scales with volume, not commodity price. Management raised rates from ₹398/MT (FY25) to ₹435/MT (FY26), signalling pricing power. They’ve committed to 10–15% annual rate hikes. No other Indian TMT player has this architecture.
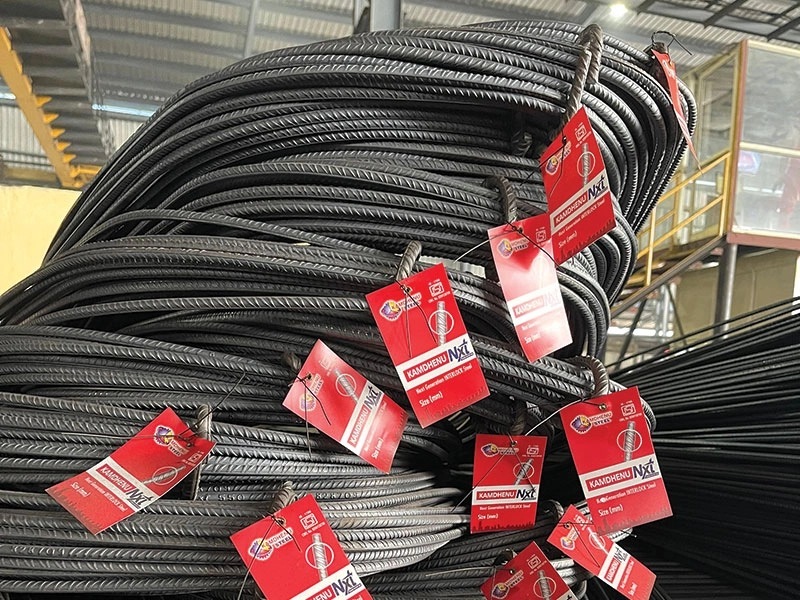
The brands within: Kamdhenu Standard (base TMT), Kamdhenu Nxt (next-gen interlock bars), Kamdhenu PAS 10000 (premium rust-proof), and structural steel products sold under dealer franchise. A paint business, Colour Dreamz, was spun off in 2023 and now trades separately.
4. Financials Overview
Figures are consolidated, in ₹ crore.
Metric
FY25
FY26
YoY Change
Revenue
747.5
763.4
+2.1%
EBITDA
64.5
101.0
+56.6%
PAT
60.9
78.4
+28.7%
EPS (₹)
2.19
2.78
+27.0%
Q4FY26 (Jan–Mar 2026):
Sales ₹207.6 crore, up 5% YoY. Net profit ₹17.4 crore, up 2% YoY. Q4 benefited from operating leverage: operating margin hit 16.3% versus 12% in Q4FY25. The company exited March with PAT margin at 8.4%, versus 8.6% in the prior quarter—a slight compression, driven by one-off other income swings.
Revenue Mix (FY26): Own manufacturing revenue: ₹588.5 crore (77% of sales). Royalty income: ₹174.5 crore (23% of sales).
Royalty income grew 25% YoY despite total sales up only 2%. The arithmetic: franchisee volumes scaled 10% and rates rose ~9% (₹398 to ₹435 per MT). Own manufacturing revenue fell slightly, dented by a 2.6% drop in average selling price for TMT (from ₹51,947 to ₹50,622 per MT), even as volumes rose 4%.
Profitability Story:
EBITDA margin expanded 560 basis points to 13.2% in FY26, from 8.6% in FY25. This was largely driven by lower raw material costs (as a % of sales: 67.8% in FY26 vs 70% in FY25) and a richer royalty mix. Interest expense is now negligible (₹0.77 crore). Tax rate stayed at 25.8%.
Concall Insights (May 2026):
Management disclosed ~₹300 crore in cash and treasury investments, far above the ₹27.8 crore shown on the balance sheet as liquid cash. The company is “framing a policy for treasury…how we can reward…shareholders,” but no decision has been made on dividends, buybacks, or capex beyond stated plans. They also invested ~₹20 crore in the paint business (Kamdhenu Ventures Limited) in March 2026, on the grounds that share price was depressed relative to business valuation. No further paint infusions are planned.
5. Valuation Discussion: Fair Value Range (Educational Only)
What follows is a walkthrough of how three valuation methods work, using this company’s numbers as the example — not a target, not a forecast, not advice.
Method 1 (P/E Multiple): Annualised EPS (FY26, full-year basis) = ₹2.78. Peer band P/E for mid-cap steel = 16x–26x (APL Apollo 42x, Welspun 23x, Shyam Metalics 26x, Godawari Power 23x). Applying the peer band 16–26x produces ₹44.48–₹72.28.
Method 2 (EV/EBITDA): FY26 EBITDA = ₹101.0 crore. Peer band EV/EBITDA = 6.1x–22.9x (median ≈ 13.3x across the sample). Enterprise Value = Market Cap + Net Debt. Kamdhenu has nil debt and ~₹28 crore net cash. At ₹25 stock price, EV = ₹704 − 28 = ₹676 crore. This implies 6.7x EV/EBITDA. Applying peer band 13–23x to ₹101 crore EBITDA produces ₹1,313–₹2,323 crore EV, which translates to ₹55–₹113 per share (after adjusting for net cash).
Method 3 (Simplified DCF): Assume 10% revenue CAGR, 13% EBITDA margin, 26% tax rate, 6% cost of capital. FY26 base revenue ₹763 crore. Over 5 years: terminal value ≈ ₹45–60 crore annual FCF discounted at 6% = ~₹500–600 crore. Add ₹28 crore net cash, divide by 28.19 crore shares = ₹19–22 per share.
These figures show how the methods work and are not a valuation, a target, or advice.
6. What’s Cooking
Royalty Rate Expansion: Management disclosed FY26 royalty realisation at ₹435/MT