Kaka Industries FY26: The High-Volume Polymer Expansion vs the Weight of ₹104 Crore Debt
Section 1 — At a Glance
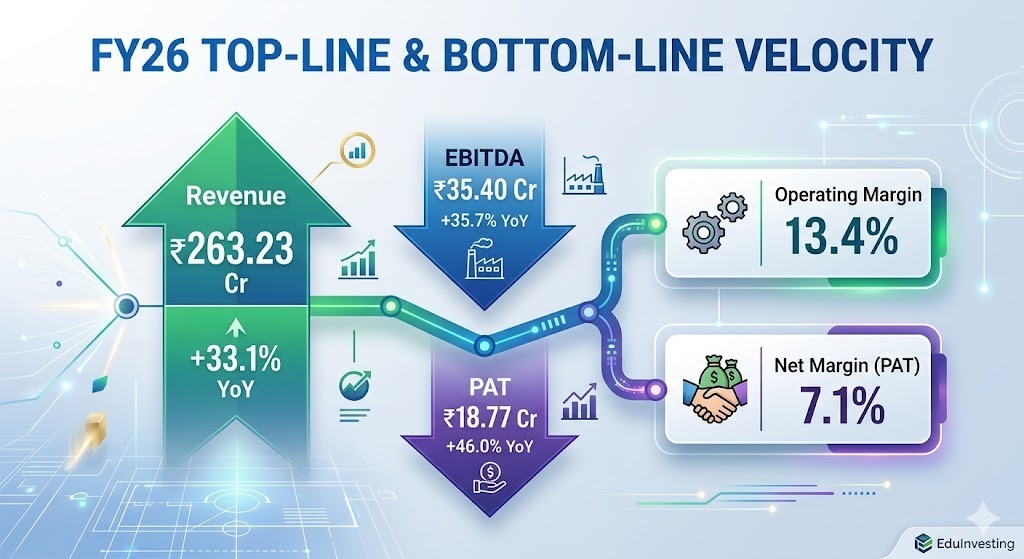
Kaka Industries Ltd wrapped up the financial year ending March 31, 2026, with revenue from operations scaling to a record ₹263.23 crore, marking an efficient top-line expansion of 33.1% over the prior year’s ₹197.78 crore. Profit after tax (PAT) jumped even sharper, climbing 46.0% to reach ₹18.77 crore from ₹12.86 crore in FY25, validating a robust structural run-rate across its core manufacturing divisions.
Operating profit (EBITDA) came in strong at ₹35.40 crore, up 35.7% from ₹26.08 crore, lifting the full-year EBITDA margin marginally by 26 basis points to 13.4%. This profitable surge was primarily unlocked by resolving past power supply bottlenecks and expanding total volume capacity at the fully integrated plant in Lasundra, Gujarat.
However, the rapid asset scaling has come with intense working capital absorption. While investor sentiment is being buoyed by massive volume growth in core PVC and WPC segments, a sharp parallel climb in gross debt—which reached ₹103.66 crore by March 2026—remains a core point of long-term leverage concern. Capital allocation strategies require optimal asset turns to convert raw manufacturing volume into high-velocity liquidity. The primary narrative for the coming quarters rests on whether this manufacturing scale can build significant positive free cash flows, or if it will be continually consumed by heavy capital re-investment cycles.
Section 2 — Introduction
Kaka Industries Ltd is a polymer-focused manufacturer that has rapidly shifted its organizational model from a basic regional proprietorship firm established in 2000 to a publicly listed corporate entity. Positioned firmly within the industrial plastic products manufacturing landscape, the company specializes in capitalizing on timber-substitution trends by outputting a massive variance of polymer-based internal fittings and building profiles.
The primary purpose of analyzing the firm at this juncture is its structural transition. Having scaled its core capacities, established dedicated distribution depots across strategic locations like Hyderabad, Noida, and Ahmedabad, and commissioned major backward integration blocks, the company is attempting to transition from a localized microcap player into a institutionalized mainboard contender. This article dissects whether the underlying financial balance sheet contains the structural engineering needed to sustain this momentum or if the framework is stretching under pressure.
Section 3 — Business Model: WTF Do They Even Do?
To the smart but slightly lazy investor, Kaka Industries is essentially an extrusion factory that turns synthetic PVC resin into replacements for traditional wooden furniture, doors, and building panels. It manages a highly diversified house of brands designed to capture different financial strata of the B2B and retail markets—ranging from high-end premium products under Kaka Excellent and Jinwin to price-sensitive value profiles via Nice Plast and Barbarika.
Revenue Mix Breakdown
The structural composition of the top-line reveals where the true commercial momentum resides:
The underlying thesis relies heavily on eco-friendly timber substitution—convincing construction channels that extruded polyvinyl chloride and wood-polymer composites look like premium wood but resist moisture, termites, and rotting without requiring chemical preservation coats. They distribute this via 3 depots servicing more than 450 active dealer points across 20 states and union territories. They also selectively pitch to government agencies, though structural project backlogs are entirely absent since sales are driven purely via a month-on-month dealer channel fulfillment model.
Section 4 — Financials Overview
Figures are standalone, in ₹ crore.
The corporate reporting mechanism utilizes a half-yearly frequency under its current small-and-medium enterprise compliance guidelines. The performance over the sequential half-year periods demonstrates clear top-line acceleration.
Half-Yearly Financial Velocity
Metric
Latest Half (Mar 2026)
YoY (Same Half)
Previous Half (Sep 2025)
Revenue
₹138.34 cr
+35.2%
₹124.89 cr
EBITDA / Operating Profit
₹18.65 cr
+39.8%
₹16.75 cr
PAT
₹9.92 cr
+56.3%
₹8.85 cr
EPS (Reported)
₹7.26
+56.2%
₹6.48
The earnings numbers showcase highly respectable year-on-year jumps. Top-line growth of 35.2% in H2 FY26 reflects stable capacity ramp-ups at the new industrial complex. Margins stayed flat half-on-half as localized price discounting was deployed to win over dealer channels in newer geographic boundaries like Rajasthan and Madhya Pradesh. Earnings quality is highly authentic when operating leverage moves in lockstep with volume capacity expansion rather than relying on arbitrary accounting adjustments.
What is Management Promising in the Coming Quarters?