Kwality Pharmaceuticals Ltd. Mar 2026: Working Capital Strain Spikes Debtors to ₹280 Crore Despite 69% PAT Explosion
Section 1 — At a Glance
Kwality Pharmaceuticals Ltd. delivered an exceptionally strong headline performance for the fiscal year ended March 31, 2026, driven by aggressive capacity utilization and a structural pivot into high-value product lines. Annual revenue from operations crossed a critical threshold, surging 36% to ₹503.08 crore from ₹370.20 crore in the previous fiscal year. Profitability metrics expanded at an even faster clip, as Profit After Tax (PAT) escalated by 69% to hit ₹67.35 crore, compared to ₹39.85 crore in FY25, highlighting substantial operating leverage as fixed compliance overheads stabilized against a expanding topline. Operating EBITDA surged 47% to ₹118.33 crore, reflecting an absolute expansion in core performance.
However, this rapid operational scaling has extracted a heavy toll on the balance sheet’s liquidity architecture. The company’s growth remains deeply working-capital intensive, marked by an acute escalation in trade receivables, which ballooned from ₹154.31 crore to ₹280.05 crore over the twelve-month period. This widening collection cycle has constrained operational cash generation, forcing the company to heavily draw down its cash balances and rely on short-term banking lines to fund its ongoing multi-asset capex program. Investors are increasingly balancing the company’s clear technical capability to clear stringent audits against a cash conversion cycle that ties up significant equity. Growth without cash generation is simply a high-stakes race where the engine runs hot but the wheels remain stuck in the mud. The central question moving forward is whether the impending commercialization of its highly anticipated biologics and hormone facilities will yield hard cash or further balance sheet strain.
Section 2 — Introduction
Kwality Pharmaceuticals Ltd. (KPL) has quietly transformed itself from an old-school small-cap domestic drug formulator into a highly certified exporter specialized in high-barrier sterile injectables and complex generic molecules. Founded over four decades ago, the company long operated under the radar before executing a critical transition from the BSE SME platform to the main board in June 2022.
This analysis is prompted by the company’s full-year FY26 disclosures, which reveal a stark divergence between accounting profitability and cash efficiency. Kwality has spent the last few years aggressively upgrading its infrastructure to meet international standards, unlocking new export markets across Latin America, the Middle East, and parts of Europe. Yet, as it transitions from low-margin volume games in unregulated territories to long-cycle, high-margin institutional tenders, its structural financial requirements have shifted dramatically. Understanding this company now requires looking past the sparkling profit growth and evaluating the structural efficiency of the operational plumbing beneath.
Section 3 — Business Model: WTF Do They Even Do?
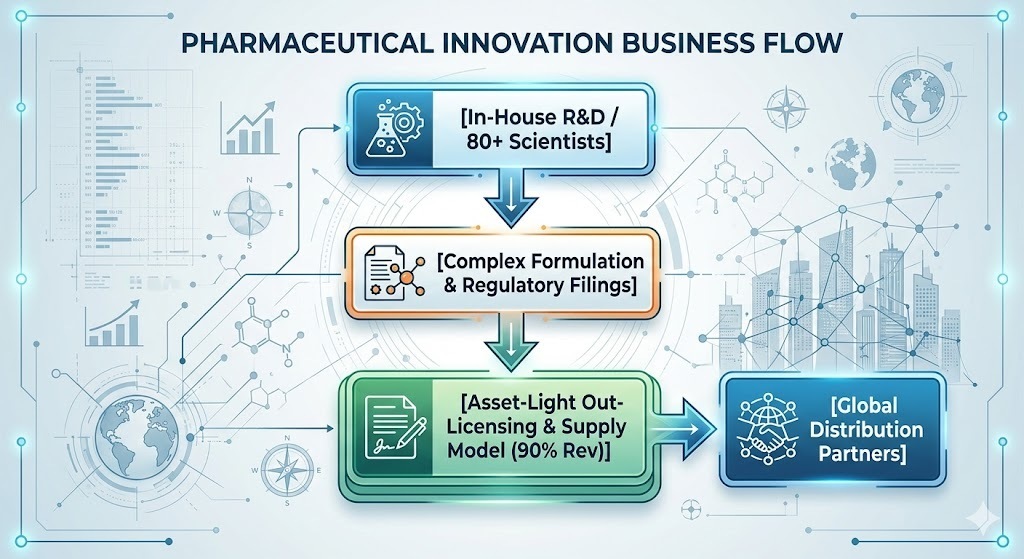
Kwality Pharma acts as an asset-light out-licensing and supply partner, alongside selective Contract Development and Manufacturing Organisation (CDMO) operations. Rather than building expensive direct-to-consumer field forces abroad, they develop complex formulations in-house, clear difficult regulatory hurdles, and sell the dossiers or finished products to global pharmaceutical distributors.
Their technical catalog spans over 3,000 formulations, with an acute structural shift toward sterile injectables, which now generate 48% of total operational revenues. They are deep into high-barrier delivery formats: liposomal pegylated injectables (expensive oncology agents), micro-sphere long-acting depots, and a rapidly developing pipeline of biological injectables like Erythropoietin. Geographically, the business is evenly divided between domestic formulations and exports across 70+ countries. They take complex, traditionally high-cost molecules, manufacture them at scale in Punjab and Himachal Pradesh, and pass the regulatory master files to international buyers who crave cheap, compliant supply.
Section 4 — Financials Overview
Figures are consolidated, in ₹ crore.
Performance Tracking Table
Metric
Latest Quarter (Q4 FY26)
YoY (%)
QoQ (%)
Full Year FY26
Full Year FY25
YoY (%)
Revenue
157.11
35.8%
27.3%
503.08
370.20
35.9%
EBITDA
38.76
50.4%
29.2%
118.33
80.40
47.2%
PAT
25.30
74.6%
58.0%
67.35
39.85
69.0%
EPS (₹)
24.38
71.7%
58.0%
64.91
38.41
69.0%
The final quarter of the fiscal year showcased strong volume execution, with quarterly sales leaping to ₹157.11 crore. EBITDA margins clocked in at a healthy 24.6% for the quarter, reflecting a clear recovery in input costs and a superior product mix heavily tilted toward oncology injectables. When margins expand faster than revenues, it usually means management has successfully decoupled from raw material commodity traps and moved into value-added segments where they hold real pricing power.
What is Management Promising in the Coming Quarters?