Astral Ltd Mar 2026 : A Massive 965 Crore Shock Slams Margins Despite High-Flying Pipe Volumes
Section 1 — At a Glance
Astral Ltd pulled off a strong top-line show in its March 2026 annual results, driving consolidated revenues up by 12.62% year-on-year to ₹6,568.60 crore. Yet, a dark financial cloud completely eclipsed this volume-led celebration. The company’s net profit flatlined, crawling up by a microscopic 2.08% to ₹534.70 crore , down from ₹523.80 crore in the prior fiscal. The structural breakage sits deep inside the operating expenses, where “Other Expenses” expanded from a modest ₹38.20 crore in fiscal 2025 to an eye-watering, logic-defying ₹965.20 crore in fiscal 2026. This massive 25-fold escalation completely flattened operating leverage, choking off what should have been a high-margin breakout year driven by post-monsoon real estate demand and localized market-share gains.
While investors are cheering an impressive sequential volume explosion—evidenced by March 2026 quarter sales surging to ₹2,088.50 crore —the balance sheet reveals significant capital friction. Net fixed assets expanded to ₹2,945.00 crore as a multi-location capital layout program eats cash, while operating cash flows faced severe compression, even though headline metrics look strong on paper. Compounding the stress, operating profit margins have been capped by tactical regional price drops and extensive distribution setup costs across the young paints and bathware segments.
Operational hyper-growth is an excellent narrative, but structural cost inflation remains the ultimate destroyer of minority shareholder returns.
Is this unprecedented surge in overhead expenses a temporary operational speed bump or a permanent downgrade to Astral’s high-margin identity? Let’s trace the trail.
Section 2 — Introduction
Astral Ltd stands as one of the definitive architectural structural stories of corporate India, transforming from an aggressive plumbing challenger in 1996 into an industrial giant commanding a massive market capitalization of ₹41,464.23 crore. The company fundamentally rewrote the rules of the domestic construction material sector by pioneering high-margin chlorinated polyvinyl chloride (CPVC) piping systems across India.
This deep dive comes at a fascinating inflection point in corporate history. The company has spent the last four years executing a massive ₹1,400.00 crore capital expenditure campaign. This strategy was designed to break freight-heavy cost structures by regionalizing production across 25 operational plants. But as these new hubs ramp up, a flurry of aggressive acquisitions—ranging from corporate takeovers in industrial adhesives to structural bets on decorative paints—has added immense organizational friction. With a high-profile leadership re-appointment solidifying the long-term strategic map, this analysis parses whether the corporate machinery is ready to harvest its massive operational investments or if structural complexity is running out of control.
Section 3 — Business Model: WTF Do They Even Do?
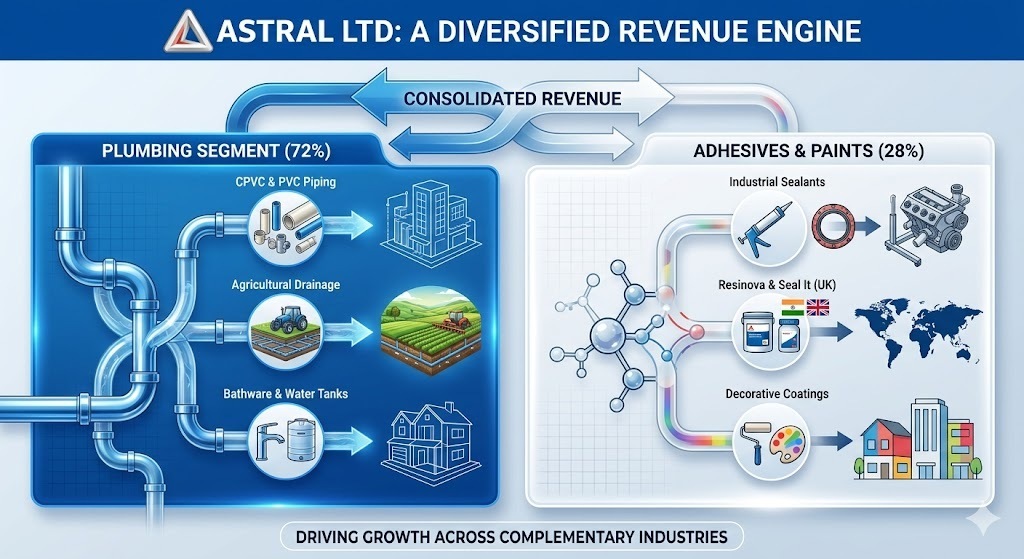
Astral’s engine runs on two core pipelines: heavy-duty fluid transport and structural chemicals.
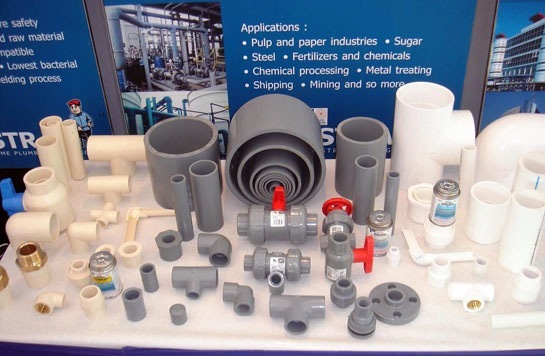
The core Plumbing segment generates 72% of consolidated sales, dealing in lead-free PVC, specialized CPVC, agricultural drainage lines, fire sprinklers, and an expanding structural lineup of water tanks and bathware. They dominate the premium, high-pressure CPVC niche, converting bulky, expensive freight liabilities into a localized advantage via decentralized manufacturing.
The remaining 28% belongs to the Paints and Adhesives vertical. This business functions as a fast-moving industrial chemical engine, delivering sealants, cyanoacrylates, construction chemicals, and decorative emulsions under the flagship brand. By pushing this multi-material lineup through an enormous domestic footprint of 3,303+ distributors and a staggering 2,29,000+ retail dealer nodes, Astral essentially extracts premium pricing from what are traditionally generic, unorganized commodities.
Section 4 — Financials Overview
Figures are consolidated, in ₹ crore.
Quarterly Performance Trend
The quarterly financial breakdown highlights a classic high-volume, low-margin execution strategy.
Metric
Latest Quarter (Mar 2026)
YoY (%)
QoQ (%)
Revenue
₹2,088.50
24.21%
35.48%
EBITDA / Operating Profit
₹382.90
26.83%
61.36%
PAT
₹213.00
18.80%
97.77%
EPS (₹)
₹7.93
18.89%
97.76%
The top-line jump to ₹2,088.50 crore in the final quarter indicates an impressive volume counter-attack against structural real estate drag and extended monsoons. However, the margins show clear signs of pricing friction. Profitability expanded sequentially, but trailing performance reveals a company sacrificing absolute pricing power to secure retail shelf space and clear out channel inventory.
Volumetric expansion achieved at the cost of realization premium often signals an intensifying competitive landscape where the consumer holds the pricing whip.
Did Management Walk the Talk?
Reviewing past forward commentary reveals an executive team navigating tough operational realities. Management previously pointed to low capacity utilization at its new state-of-the-art Hyderabad hub as a temporary drag on profit margins. True to their word, that facility has begun scaling past its initial 15% to 20% operational run-rate.
Similarly, the strategic turnaround of the UK adhesives subsidiary (Seal It