Jayesh Logistics Limited: Half Yearly & Full Year Results FY26 + The Heavy-Duty SME Cargo-Hauler Smashing P&L Goals But Stuck in a Working Capital Swamp
1. At a Glance
Jayesh Logistics Limited just dropped its audited financial results for the half-year and full-year ended March 31, 2026. If you follow the microcap and SME exchange madness, this Kolkata-headquartered cross-border freight player is screaming for your attention.
For the full year FY26, the company clocked a top-line performance of ₹129.30 crore, translating to a solid 15.6% growth over the previous year. But the real headline grabber is the net profit, which jumped to ₹10.08 crore.
This gives the stock an entry-level price-to-earnings (P/E) ratio of just 14.5 times relative to its current market capitalization of ₹146 crore. In an expensive Indian equity market where standard logistics businesses routinely trade north of 25–30 times earnings, Jayesh Logistics looks like a deep-value anomaly.
However, experienced investors know that cheap valuations in the logistics sector usually come with underlying structural catches. Beneath the highly polished income statement lies a completely different story on the balance sheet.
While profits expanded nicely, the company’s operating cash flows collapsed into deeply negative territory, coming in at a negative ₹4.80 crore for FY26. At the exact same time, trade receivables jumped to ₹49.31 crore.
This means that nearly 38% of the company’s annual revenue is currently stuck on its balance sheet as unpaid customer invoices. The business is growing its reported accounting profits, but it is not collecting hard cash from its corporate clients.
To fund this widening gap, the company has heavily loaded up its balance sheet with new debt, taking total borrowings up to ₹45.13 crore. Is Jayesh Logistics a genuine microcap growth story waiting to unlock value, or is it a classic capital-guzzling transport business heading straight into a liquidity wall? Let us dive deep into the forensic details to find out.
2. Introduction
Jayesh Logistics Limited was incorporated in May 2011, spending over a decade building a specialized regional logistics network before coming to the public capital markets. The company officially listed its shares on the NSE SME Emerge platform on November 3, 2025, after successfully raising gross proceeds of ₹28.63 crore through its initial public offering (IPO).
The operational headquarters are based in Kolkata, and the company has strategically targeted its asset deployment across the high-volume industrial corridors of Eastern India and the cross-border Indo-Nepal trade routes.
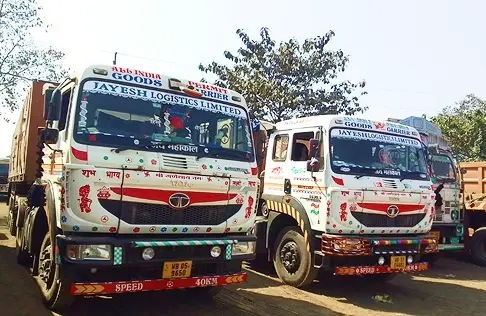
Unlike asset-light tech platforms that try to pass themselves off as logistics disruptors, Jayesh Logistics is an asset-heavy operator that deals with physical, large-scale industrial haulage. The company owns and operates a specialized fleet of 95 heavy-duty trucks, featuring flatbed and side-walled trailers engineered to handle heavy industrial raw materials and finished goods.
To maintain flexibility and cap its fixed overhead overheads during seasonal periods of lower demand, management uses a hybrid operating model. They complement their owned asset core with third-party hired trucks to fulfill large spot orders.
The customer profile is heavily weighted toward business-to-business (B2B) enterprise accounts, serving large, capital-intensive industrial groups in the infrastructure, steel, and cement sectors. Operating in these sectors requires handling highly variable regional trade cycles and dealing with massive enterprise procurement teams.
3. Business Model – WTF Do They Even Do?
To explain it simply: Jayesh Logistics moves massive amounts of heavy industrial weight from points A to B across rough terrains, handles customs bottlenecks, and bills industrial giants for the service. The company generates its revenue through two operational verticals: Freight Services and Non-Freight Value-Added Services.
Operational Vertical
Sub-Segment / Service Type
Share of Total Revenue (%)
Vertical Total (%)
Freight Services
Owned Fleet Operations
37.0%
Hired Fleet Operations
26.5%
Truck Forwarding Note (TFN) Leasing
2.1%
65.6%
Non-Freight Services
Railways, Shipping & Cargo Supervision
33.0%
Machine Rental & Customs Clearance
1.4%
34.4%
Total
All Verticals
100.0%
100.0%
Within Freight Services (which drives 65.6% of the top-line), the revenue mix is highly revealing. Moving goods using their own fleet contributes 37% of revenue, which gives them strong pricing power and high operating margins when utilization levels are high. Managing hired fleets contributes 26.5%, acting as a lower-margin volume balancer.
The remaining 2.1% comes from Truck Forwarding Note (TFN) arrangements, where they lease out their excess truck capacity to third-party operators. The secondary engine of the business is the Non-Freight Services vertical, contributing 34.4% of total revenue. This covers rail cargo handling, multi-modal port coordination at Haldia and Kolkata, machinery rentals, and customs clearance services.
The defining operational feature of this business model is its intense geographic and client concentration. The Indo-Nepal cross-border corridor alone brings in 57% of total revenue, utilizing routes like West Bengal–Raxaul–Viratnagar.
Furthermore, the company’s top 5 clients account for 57.4% of revenue, and the top 10 clients control 72%. If even a single major cement or steel customer changes their logistics vendor or delays their payments, Jayesh Logistics faces immediate financial pressure.
4. Financials Overview
The financial tables tell a clear story of strong accounting top-line momentum combined with a noticeable drop in short-term profitability during the final half of the year. Let us look at the financial performance for the period ended March 31, 2026.
Half-Yearly and Full-Year Financial Performance
Metric
Latest Half-Year (H2 FY26)
Same Period Last Year (H2 FY25)
Previous Half-Year (H1 FY26)
Full Year FY25
Full Year FY26
Revenue from Operations
₹69.97 cr
₹67.07 cr
₹59.33 cr
₹111.88 cr
₹129.30 cr
EBITDA
₹10.58 cr
₹12.37 cr
₹9.70 cr
₹17.08 cr
₹20.28 cr
Profit After Tax (PAT)
₹5.31 cr
₹6.48 cr
₹4.77 cr
₹7.22 cr
₹10.08 cr
Annualised EPS
₹10.62
₹12.96
₹9.54
₹11.35 (Actual)
₹11.60 (Actual)
Recalculated P/E Ratio
15.8x
13.0x
17.6x
14.8x
14.5x
(Note: The company reports results half-yearly. Therefore, the tables display Half-Yearly and Full-Year figures. Conversion: ₹100 Lakhs = ₹1 Crore).
A closer look at the sequential numbers shows where the friction points are developing. H2 FY26 revenue grew by 17.9% compared to H1 FY26, climbing to ₹69.97 crore as logistics volumes expanded after the monsoon season.
However, compared to the same period last year (H2 FY25), net profit dropped by 18.1%, falling from ₹6.48 crore down to ₹5.31 crore.
Why did this drop happen? Expenses for the service delivery vertical rose from ₹53.18 crore in H2 FY25 to ₹57.06 crore in H2 FY26, which put noticeable pressure on operating margins.
Additionally, the company’s financial metrics show a clear divergence between historical management projections and actual operational performance. In its earlier IPO documents, management highlighted plans