Singer India is the grandma of the home appliances world – around since 1977, famous for sewing machines that stitched your nani’s saree blouses. Today, it also sells irons, cooktops, and vacuum cleaners, but the financials are stitched with a crooked zigzag. ₹425 Cr revenue, ₹4.5 Cr PAT, 100x P/E – basically, a boutique tailor shop priced like Louis Vuitton.
2. Introduction
If Orient Bell was struggling to sell tiles, Singer India is struggling to sell the dream of sewing machines in 2025. Let’s face it – your average Gen Z would rather order a Zara top on Myntra than stitch it at home. But Singer still thrives in niche markets: small-town tailors, garment clusters, and kitchen appliance buyers looking for “trusted brands”.
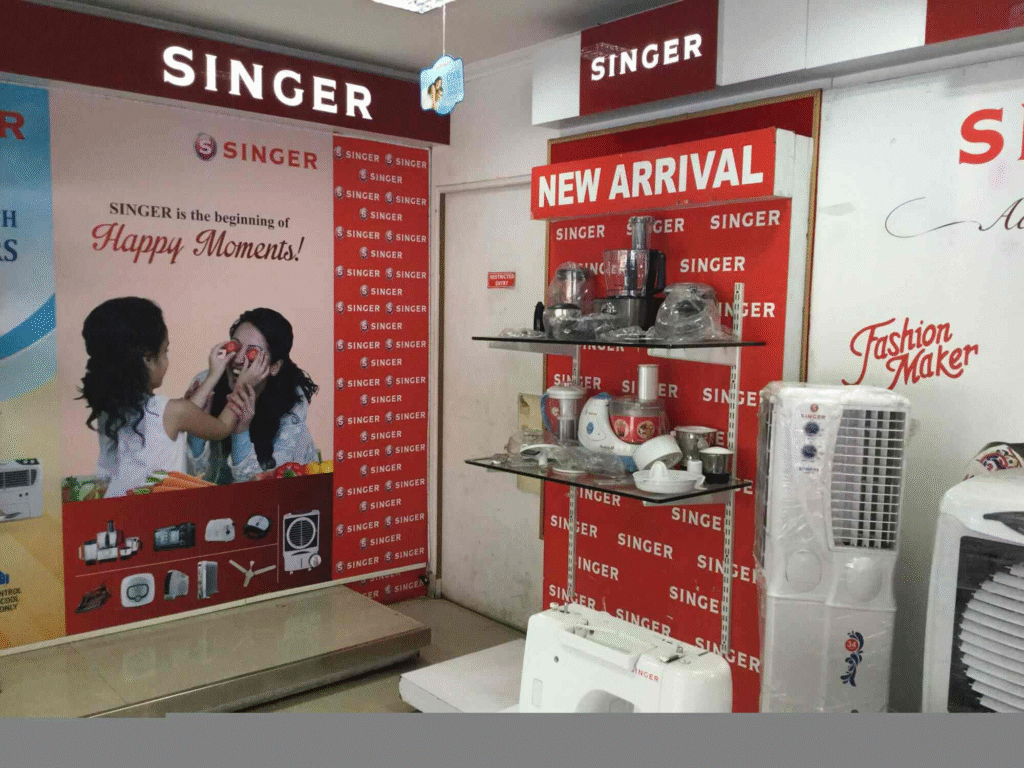
Singer India operates under SVP Worldwide, the global owner of the Singer brand. In India, it sells under “Singer” and “Merritt”, via 21 showrooms and 10,000+ retailers. But here’s the punchline – 96% of revenue is from trading goods, only 4% from manufacturing. Asset-light is good, but this is more like asset-invisible.
Still, the stock has meme-worthy volatility: 5-year return +20%, but last year -22%. Investors are basically betting that sewing machines will come back in fashion. (Maybe when Netflix launches “Tailorverse”?)
3. Business Model – WTF Do They Even Do?
Singer India works in two segments:
Sewing Machines (68%): Straight stitch, zig-zag, artisan, industrial, accessories. Think everything from household auntie machines to garment factory units.
Appliances (32%): Cooktops, kettles, irons, grinders, heaters, fans, washing machines. Basically, “adda sab kuchh” retailer for home needs.
Model = outsourced contract manufacturing + trading. Warranty liability is passed back to vendors, so Singer is essentially a brand + distribution network.
In short: They’re less of a “manufacturer” and more of a “logo printer on someone else’s product”.
4. Financials Overview
Quarterly Snapshot (₹ Cr)
Metric
Latest Qtr (Jun’25)
YoY Qtr (Jun’24)
Prev Qtr (Mar’25)
YoY %
QoQ %
Revenue
92.1
98.7
121.7
-6.7%
-24%
EBITDA
-3.7
-0.03
4.1
N.A.
N.A.
PAT
-2.36
0.56
4.05
-521%
N.A.
EPS (₹)
-0.38
0.09
0.66
N.A.
N.A.
Commentary: Margins thinner than a thread – OPM <1%. Q1 FY26 was a disaster with losses due to BIS license issues + a fire at the office. At 100x earnings, the stock is like buying a broken sewing kit at DLF Emporio.
5. Valuation – Fair Value Range Only
P/E Method: EPS ₹0.73, apply industry PE ~25 → FV = ₹18–20.