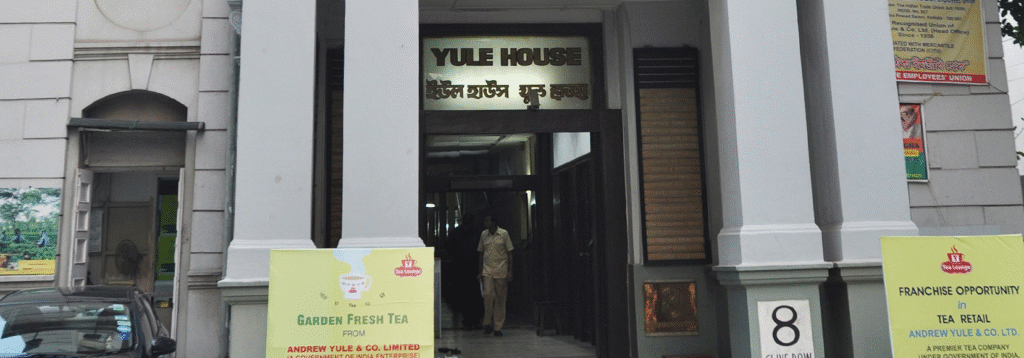
1.At a Glance
A 1919 vintage that’s somehow still listed. Once a managing agency, now a Government-owned multi-vertical curiosity selling tea, transformers, fans, and pollution control gear. Market cap ₹1,277 Cr, but 89% is promoter (Govt) — so public float is smaller than its Darjeeling estate. ROE negative, sales flat for 5 years, and yet a P/E of 64. Because PSU logic.
2.Introduction
If there was an award for “Most Random Product Portfolio,” Andrew Yule would be sipping the trophy. This CPSE juggles:
- Tea from Assam, Dooars, and Darjeeling
- Transformers and electrical gear
- Heavy fans & pollution control systems
- Tea machinery (meta!)
It’s the corporate version of a vintage trunk in your grandparents’ attic — full of relics, some still useful, others just collecting dust.
Acquired by the Govt in 1979 after losing its original business model, it’s been in survival mode ever since — closing unviable units, merging a printing company for reasons unknown, and still trying to double tea business by 2032. The problem? At its current sales growth rate of 0.83% CAGR, that’s a fantasy novel.
3.Business Model (WTF Do They Even Do?)
Tea Division (58% revenue):12 estates, orthodox & green tea, recently dipped into specialty blends. Competes with private players who can market better and don’t have to wait for government approvals to buy a tea spoon.
Engineering Division (27%):Fans, ESPs, pollution control. Order book ~₹55 Cr, 6% market share.
Electrical Division (15%):Transformers from 8 MVA to 63 MVA capacity. Order book ~₹75 Cr in 2023, but low market share.
Revenue is split across cyclical engineering orders and seasonal tea sales. Margins are… well, non-existent most years, saved only by “Other Income” — basically PSU
for “let’s sell some assets or get subsidies.”
4.Financials Overview
| Metric | Q1 FY26 | Q1 FY25 | Q4 FY25 | YoY % | QoQ % |
|---|---|---|---|---|---|
| Revenue (₹ Cr) | 56.1 | 55.5 | 98.0 | 1.1% | -42.8% |
| EBITDA (₹ Cr) | -28.0 | -12.0 | -42.0 | -133% | 33.3% |
| PAT (₹ Cr) | 20.1 | 2.03 | -1.0 | 890% | 2,110% |
| EPS (₹) | 0.41 | 0.04 | -0.01 | 925% | — |
| EPS Ann. (₹) | 1.64 | — | — | — | — |
Commentary:PAT explosion thanks to ₹60 Cr “Other Income.” Without that, the loss party continues. QoQ revenue collapse is seasonal tea off-season + lumpy engineering orders.
5.Valuation (Fair Value RANGE only)
P/E Method:EPS Ann. = ₹1.64Industry P/E ≈ 16.5FV = ₹27.1
EV/EBITDA Method:EV = ₹1,344 CrEBITDA Ann. = negative → not meaningful
DCF:Cash flows too erratic; tea + engineering volatility kills forecast reliability. Rough FV from asset value ≈ ₹22–₹25.
FV Range:₹22 – ₹27Disclaimer: This FV range is for educational purposes only and is not investment advice.
6.What’s Cooking – News, Triggers, Drama
- Tea Doubling Plan:Wants to double tea business by FY32 via new estates + bought-leaf capacity. At current pace, will need divine intervention.
- Engineering Capacity


