1. At a Glance
Indo Tech Transformers isn’t just in the business of moving electrons from point A to point B — it’s in the business of turning raw copper, steel, and investor anxiety into finished electrical behemoths. With capacity utilisation shooting from a lazy 48% in FY23 to an 88% near-burnout in FY25, the company is buzzing harder than a faulty substation on a rainy day. But here’s the twist: while operational gears hum,77.8% of the promoter shares are pledged— because why not add a little suspense to the high-voltage drama?
2. Introduction
Think of Indo Tech Transformers as the quiet kid in the electrical class — until recently, when it walked into the market wearing sunglasses and a “200 MVA” badge.
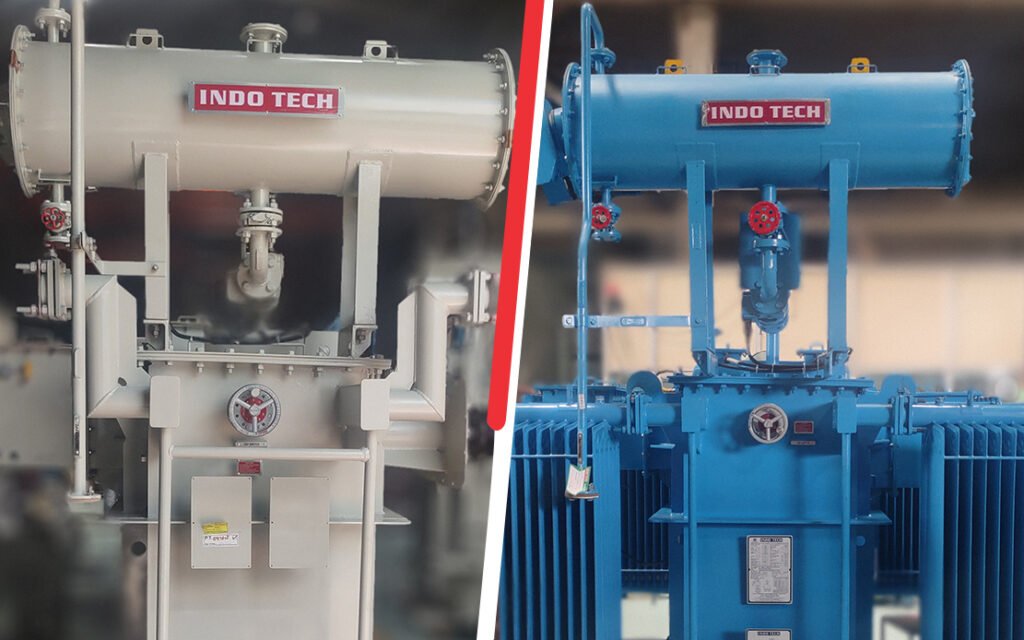
Founded in Tamil Nadu, it makes everything from your neighbourhood distribution transformer to those hulking 200 MVA beasts that power industrial belts, wind farms, and the occasional government tender project that takes 18 months to clear.
In FY25, Indo Tech’s story arc shifted. Revenues surged, profits charged up, and order books fattened to ₹830 crore. The capacity utilisation? On fire. The promoter backing? Shirdi Sai Electricals Ltd — an experienced transformer giant bringing procurement muscle, EPC know-how, and likely a better canteen menu.
But of course, no corporate masala is complete without a pinch of courtroom drama — hence the interim injunction against trade unions this July. Because if you’re going to expand to 16,000 MVA capacity by FY27, you can’t have random strikes short-circuiting production.
3. Business Model (WTF Do They Even Do?)
In short: Indo Tech takes heavy metals, windings, and engineering know-how to make products that quietly power your life until one day they blow, and you curse the power company.
Main Revenue Sources:
- Distribution Transformers(100 KVA / 11 KV to 5000 KVA / 33 KV) — these feed electricity to residential, commercial, and industrial loads.
- Power Transformers(5 MVA / 33 KV to 31.5 MVA / 132 KV) — for bigger industrial applications and grid work.
- Large Power Transformers(up to 200 MVA / 230 KV) — these handle power plant outputs, big substation needs, and national grid requirements.
- Skid-Mounted Substations— for windmills
- and mobile setups.
Contract Mix:
- Fixed Price Contracts: 59% FY25 (vs 50% FY23) — more predictability, but risk if input costs spike.
- Variable Price Contracts: 41% FY25 (vs 50% FY23) — inflation safety net, but lower margins if commodity prices drop.
Their clients list is a who’s who of power: NTPC, Adani, L&T, ABB, Siemens, JSW Steel, Suzlon, and even TNEB (because what’s an Indian transformer company without the local state board on speed dial?).
4. Financials Overview
| Metric | Latest Qtr (Jun’25) | YoY Qtr (Jun’24) | Prev Qtr (Mar’25) | YoY % | QoQ % |
|---|---|---|---|---|---|
| Revenue (₹ Cr) | 164.0 | 82.0 | 206.0 | 100.0% | -20.4% |
| EBITDA (₹ Cr) | 24.0 | 8.0 | 21.0 | 200.0% | 14.3% |
| PAT (₹ Cr) | 19.17 | 6.0 | 21.0 | 219.5% | -8.7% |
| EPS (₹) | 18.05 | 5.56 | 19.76 | 224.4% | -8.6% |
Commentary:
- YoY, the business basically doubled — a 100% revenue jump and an EPS leap worthy of Olympic records.
- QoQ, revenue and PAT dipped thanks to the seasonality and project delivery timing — because transformers don’t exactly fly off shelves like iPhones.
- The operating margin improved to 15% in the latest quarter, signalling that their procurement synergy story isn’t just marketing fluff.
5. Valuation (Fair Value RANGE only)
Method 1: P/E Multiple
- EPS (TTM): ₹72.65
- Apply reasonable industry P/E range: 22x – 28x
- FV Range: ₹1,598 – ₹2,034
Method 2: EV/EBITDA
- EBITDA (TTM): ₹92 Cr
- Net Debt: ~₹(31) Cr (net cash)
- EV/EBITDA range: 14x – 16x → EV: ₹1,288


