Ashapura Minechem: ₹1,356 Cr Quarter – Digging Profits Faster Than Their Mines
1. At a Glance
Q1 FY26 was a blast (literally, given the mining business) — revenue up 90% YoY, PAT up ~90%, and OPM steady at 13%. At ₹502 a share and a 14.3x P/E, this is one of the cheaper plays in a sector where peers swing wildly between single-digit and nosebleed valuations. ROE at 26.6% says they’re turning every rupee of equity into gold… or at least bentonite.
2. Introduction
Founded in 1982, Ashapura Minechem is the mineral buffet you didn’t know you needed — bentonite, bauxite, kaolin, alumina, refractories, adsorbents, white minerals, and even hydrocarbon exploration materials. Think of them as the guy in every industry’s supply chain who nobody notices until he goes missing and production grinds to a halt.
From supplying the steel sector to providing “super specialty refined mineral products” (which sounds like a health drink but isn’t), Ashapura plays across multiple verticals, which gives them a diversified earnings base and a hedge against commodity cycles — at least when global shipping and litigation don’t get in the way.
And yes, they’ve had their share of court battles — from settling disputes to challenging bank claims. Apparently, in mining, “extraction” applies to both minerals and legal fees.
3. Business Model (WTF Do They Even Do?)
Ashapura’s business runs on three big gears:
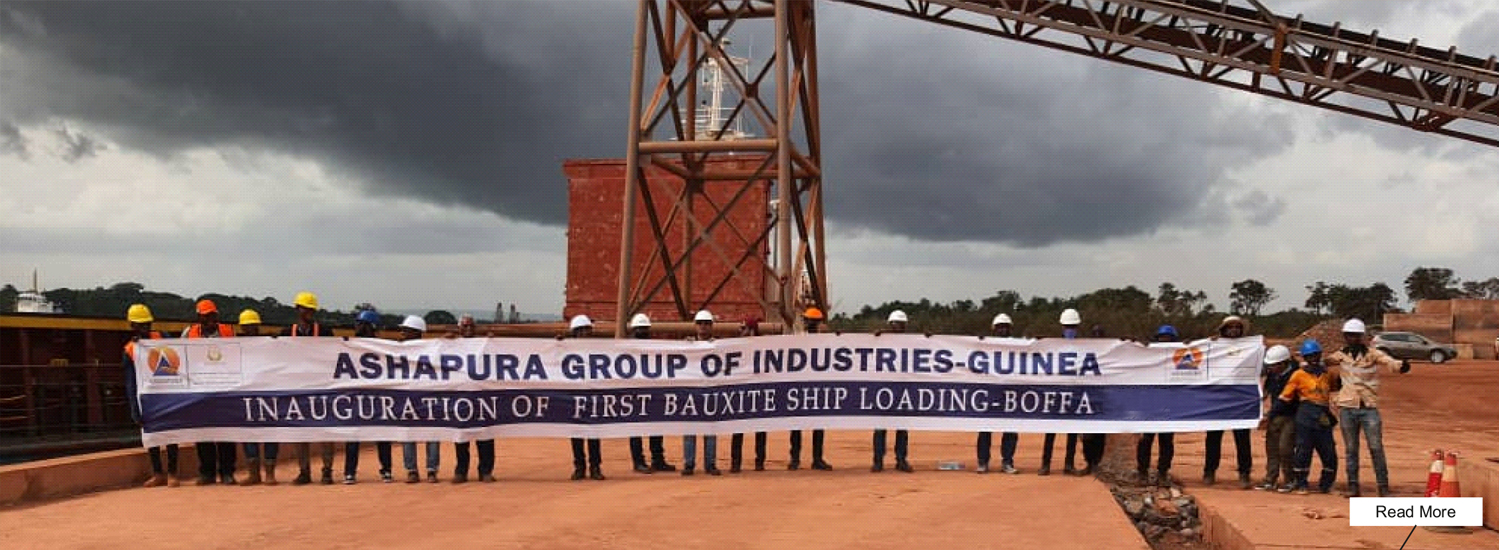
Mining & Processing: Core minerals like bauxite and bentonite extracted from India and abroad (notably Guinea).
Value-Added Products: Refractories, adsorbents, white performance minerals for higher margins.
Logistics & Exports: Strong overseas presence — 7 countries — with a big chunk of Q1 growth driven by Guinea exports.
It’s a “dig, refine, ship, repeat” model, but with enough vertical integration to control costs and enough product variety to weather demand swings.
4. Financials Overview
Metric
Q1 FY26
Q1 FY25
Q4 FY25
YoY %
QoQ %
Revenue (₹ Cr)
1,356
714
555
89.81%
144.14%
EBITDA (₹ Cr)
182
87
84
109.20%
116.67%
PAT (₹ Cr)
114
60
79
90.00%
44.30%
EPS (₹)
11.50
6.51
9.05
76.50%
27.07%
Commentary: This is not just a rebound — it’s a mining-sector flex. EBITDA more than doubled, and margins are holding in the teens despite commodity price volatility.