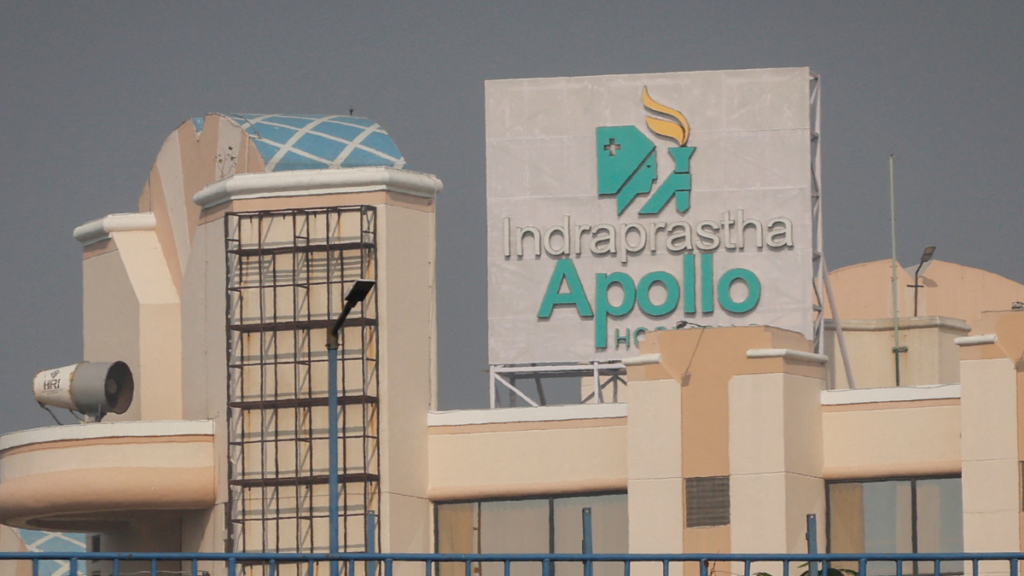
1. At a Glance
Apollo Hospitals just posted Q1 FY26 numbers that could make both doctors and accountants smile — revenue up 14.9% YoY, PAT up 41.8%, and a market cap of ₹1.12 lakh crore. With a ₹7,808 stock price, it’s now more expensive per share than some medical procedures. ROE stands at 18.4%, proving they can heal both patients and balance sheets. But at71x P/E, you’re paying for today’s surgery and tomorrow’s hospital wing.
2. Introduction
Founded in 1983 by Dr. Prathap C Reddy, Apollo was India’s first corporate hospital — a pioneer that turned healthcare into a well-oiled business machine. From a single hospital to73 locations with over 10,000 beds, the chain has become Asia’s healthcare mall, offering everything from surgeries to pharmacy chains to diagnostic clinics.
It’s the place where you might come in for a check-up and leave with a bill longer than your MRI scan report. But investors don’t mind — Apollo’s five-year profit CAGR is a clean 36%, and the dividend payout is a respectable 21.5%. The only infection here? Valuation fever.
3. Business Model (WTF Do They Even Do?)
Apollo’s model is a three-pronged money machine:
- Healthcare Services (52% of revenue): In-patient treatments, surgeries, and hospital care.
- Pharmacies: India’s most omnipresent prescription-peddling chain.
- Diagnostics & Primary Care: Scans, tests, and outpatient services.
They own, manage, and franchise hospitals, with 45 owned facilities (8,709 beds), day surgery/cradle units, and O&M contracts. In simple terms: they operate everything from
ICU beds to wellness checks, and they make money whether you’re there for a bypass or a vitamin deficiency.
4. Financials Overview
| Metric | Q1 FY26 | Q1 FY25 | Q4 FY25 | YoY % | QoQ % |
|---|---|---|---|---|---|
| Revenue (₹ Cr) | 5,842 | 5,086 | 5,592 | 14.88% | 4.47% |
| EBITDA (₹ Cr) | 852 | 675 | 770 | 26.22% | 10.65% |
| PAT (₹ Cr) | 441 | 311 | 414 | 41.80% | 6.52% |
| EPS (₹) | 30.10 | 21.23 | 27.10 | 41.75% | 11.06% |
Commentary:Margins are now at 15%, up from 13% — Apollo’s billing efficiency is clearly in “consultant doctor” mode.
5. Valuation (Fair Value RANGE only)
Method 1 – P/E:
- EPS TTM = ₹109.43
- Peer avg. P/E ≈ 65x (hospitals).
- FV range = ₹7,100 – ₹8,200.
Method 2 – EV/EBITDA:
- EV ≈ ₹1,12,273 Cr (mcap) + ₹7,864 Cr (debt) – ₹100 Cr (cash) ≈ ₹1,20,037 Cr.
- TTM EBITDA ≈ ₹3,199 Cr → EV/EBITDA ≈ 37.5x.
- Fair range (industry 30–35x) = ₹6,800 – ₹8,000.
Method 3 – DCF:
- Assume 14% PAT CAGR, WACC 10%, terminal growth 4%.
- FV range ≈ ₹7,000 – ₹8,100.
Educational FV Range:₹6,800 – ₹8,200


