1. At a Glance
Senco Gold just dropped a Q1 FY26 performance that could make a diamond blush — revenue up 30%, EBITDA up 68.6%, and PAT up 102% YoY. Ten new showrooms added in one quarter — because why just sell gold, when you can blanket the map with it? But before you think it’s Titan 2.0, note: working capital days have gone from 46.8 to 67.2 — in retail jewellery terms, that’s like keeping your customer’s wedding necklace in the vault for two extra months before payment.
2. Introduction
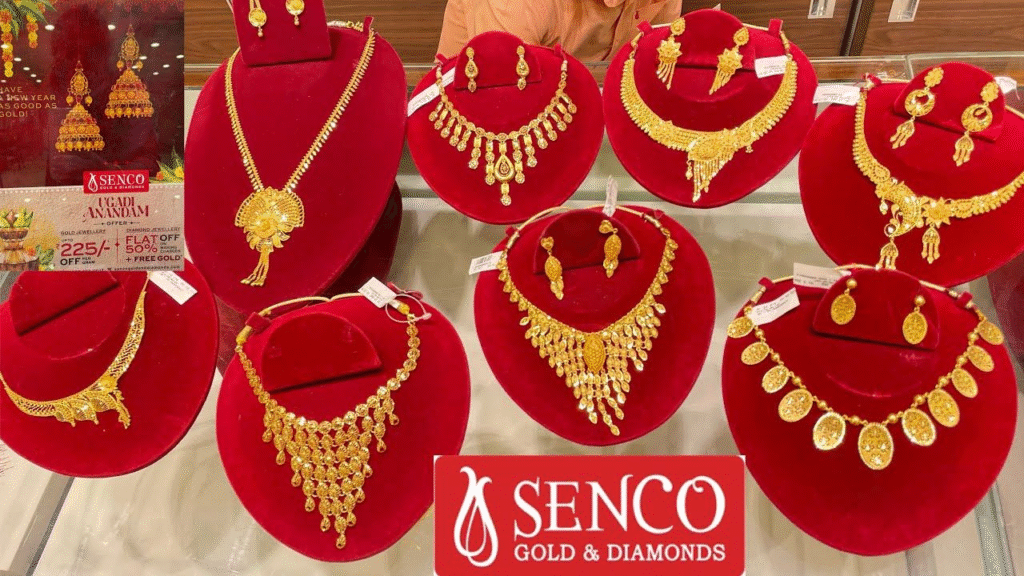
Founded in 1994 but backed by four generations of jewellery pedigree, Senco Gold has become Eastern India’s largest organized jewellery retailer by store count. It’s now in Pan-India expansion mode, leveraging both tradition and private equity backing (Elevation Capital in 2014, Oman India Joint Investment Fund II in 2022) to scale aggressively.
The model is simple: bring the sparkle, bring the trust, and bring the financing to make sure customers walk away with more than they intended to buy. The execution? Smart enough to double profits in a year. But the stock’s down ~37% in a year from its highs, proving that in the markets, even gold can lose shine if investors smell risk.
3. Business Model (WTF Do They Even Do?)
- Core: Retail sale of gold, diamond, and precious stone jewellery.
- Network: 160+ showrooms (as of Q1 FY26), company-owned and franchise.
- Margins: High in diamond, medium in gold, low in silver — so they sell all three to balance volume and profitability.
- Growth lever: Aggressive showroom addition
- + branding + wedding season push.
Like most jewellers, it thrives on volume turnover, customer trust, and managing gold price volatility without getting burnt.
4. Financials Overview
| Metric | Q1 FY26 | Q1 FY25 | Q4 FY25 | YoY % | QoQ % |
|---|---|---|---|---|---|
| Revenue (₹ Cr) | 1,825 | 1,415 | 1,362 | 28.95% | 33.99% |
| EBITDA (₹ Cr) | 183.5 | 108.8 | 126 | 68.6% | 45.6% |
| PAT (₹ Cr) | 104.6 | 51.8 | 62 | 102.0% | 68.7% |
| EPS (₹) | 6.32 | 3.43 | 3.78 | 84.3% | 67.2% |
Commentary:Margin expansion from 7.7% to 10% shows Senco’s upselling diamonds harder than your cousin’s MLM pitch.
5. Valuation (Fair Value RANGE only)
Method 1 – P/E:
- EPS TTM = ₹13.21
- Peer avg. P/E ≈ 35x (ex-Titan premium).
- FV range = ₹460 – ₹500.
Method 2 – EV/EBITDA:
- EV ≈ ₹5,542 Cr (mcap) + ₹2,046 Cr (debt) – ₹50 Cr (cash) ≈ ₹7,538 Cr.
- TTM EBITDA ≈ ₹443 Cr → EV/EBITDA ≈ 17.0x.
- Fair range (industry 15–18x) = ₹390 – ₹480.
Method 3 – DCF:
- Assume 15% CAGR in PAT, WACC 11%, terminal growth 4%.
- FV range ≈ ₹400 – ₹470.
Educational FV Range:₹390 – ₹500For educational


