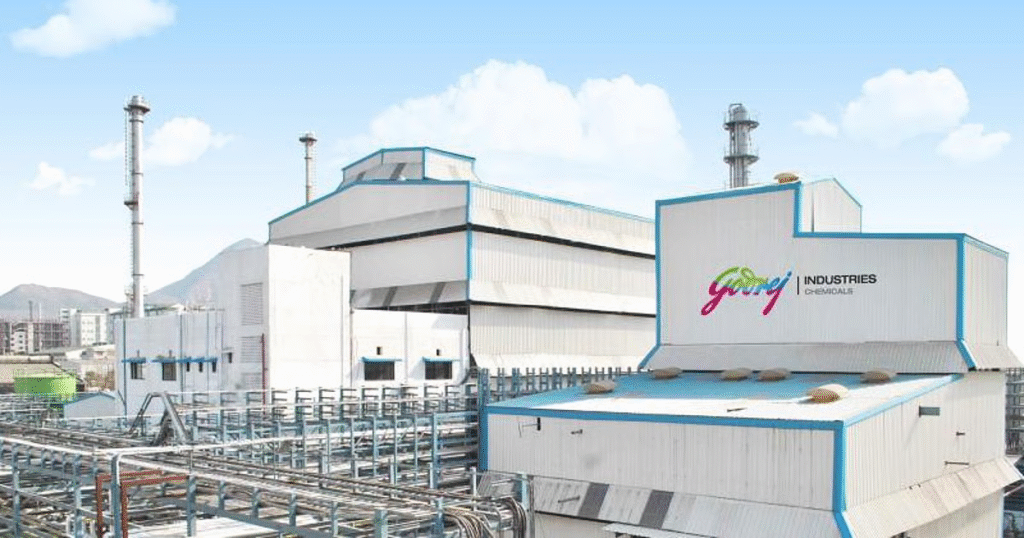
1. At a Glance
Godrej Industries is that rich uncle at the family wedding — doesn’t do all the dancing himself but owns half the dance floor. Between oleochemicals, real estate, agro-business, and a chunk of Godrej Consumer Products, it has turned “holding company” into an art form. Q1 FY26 saw profits jump8% YoY, helped not just by operations but a fat dose of “Other Income” — ₹1,352 Cr worth this quarter.
2. Introduction
This is not your average FMCG company. This is the nerve center of the Godrej empire — part manufacturer, part landlord, part investor, part magician turning dividend cheques into bottom-line magic.
The challenge? A P/E of39.2for a business where operating margins are often in single digits and debt is higher than your housing society’s complaints about parking. The opportunity? Those strategic holdings in Godrej Properties, Godrej Consumer Products, and Godrej Agrovet are compounding machines.
3. Business Model (WTF Do They Even Do?)
- Oleochemicals Manufacturing– Soap noodles, fatty acids, glycerin.
- Godrej Agrovet Stake– Agri-products, animal feed, and dairy.
- Godrej Properties Stake– Real estate development.
- Godrej Consumer Products Stake– Household and personal care brands like Goodknight, Cinthol, HIT.
- Godrej Capital & Others– Financial services, emerging ventures.
In short:40% manufacturing, 60% owning cool companies, 100% Godrej.
4. Financials Overview
| Metric | Q1 FY26 | Q1 FY25 | Q4 FY25 | YoY % | QoQ % |
|---|---|---|---|---|---|
| Revenue (₹ Cr) | 4,460 | 4,248 | 5,780 | 4.99% | -22.82% |
| EBITDA (₹ Cr) | 397 | 334 | 593 | 18.86% | -33.05% |
| PAT (₹ Cr) | 725.35 | 670.00* | 416 | 8.29% | 74.30% |
| EPS (₹) | 10.37 | 9.58 | 5.44 | 8.25% | 90.63% |
*Q1 FY25 PAT estimated from historical EPS and share count.
Commentary:
- Revenue flat YoY, but PAT boosted by hefty other income.
- QoQ revenue drop
- due to seasonal lumpiness (real estate recognition cycles + investment gains).
- EBITDA margins at 9% — still below peer averages in FMCG, but this isn’t pure FMCG.
5. Valuation (Fair Value RANGE only)
Method 1: P/E Approach
- TTM EPS = ₹29.94
- Holding company discount applied: assume 25–30% haircut on P/E vs. peers.
- Sector P/E (diversified) ≈ 25 → Adjusted P/E ≈ 18–19.
- FV = ₹29.94 × 18–19 ≈ ₹540 – ₹570.
Method 2: EV/EBITDA
- TTM EBITDA ≈ ₹2,162 Cr.
- Sector EV/EBITDA ≈ 12.
- Debt ≈ ₹38,088 Cr; large investments offset some EV pressure.
- FV/share ≈ ₹560 – ₹580 after investment value adjustments.
Method 3: SOTP (Sum of Parts)
- Value of listed holdings (GCPL, GPL, Agrovet) ≈ ₹65,000 Cr.
- Apply 30% holdco discount, add standalone biz value ≈ ₹6,000 Cr.
- FV ≈ ₹500 – ₹550.
Educational FV Range:₹500 – ₹580This FV range is for educational purposes only and is not


