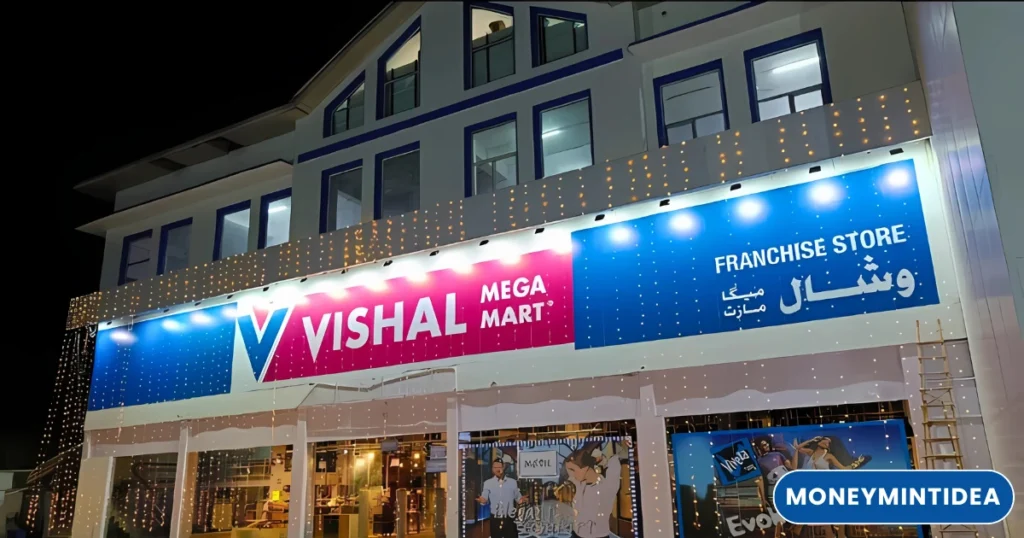
1. At a Glance
Vishal Mega Mart is the hypermarket chain that went from being the “cheap-but-cheerful” place your mom took you for bulk shopping, to a ₹67,000 crore retail beast… and apparently, investors think it’s the next Avenue Supermarts. Witha P/E of 97.7, you’d think they were selling gold biscuits disguised as atta packets. Q1 FY26 saw 23 new stores, strong same-store sales growth (SSSG) of 10.5%, and a PAT jump of 37%. Not bad for a chain that still makes you pay ₹5 for a plastic bag.
2. Introduction
Vishal Mega Mart started in 2001 and now sits comfortably in 414 cities, serving India’s middle and lower-middle-income shoppers. They sell everything from T-shirts that shrink after two washes, to kitchen mixers that sound like helicopters, to rice sacks bigger than your nephew. The e-commerce platform exists, but the real action is in brick-and-mortar — because nothing beats the thrill of finding buy-one-get-three-offers while fighting over the last discounted bedsheet.
3. Business Model (WTF Do They Even Do?)
- Apparel– From office formals to “home shorts” that you’ll never wear outside
- General Merchandise– Plastics, electronics, utensils, home goods
- FMCG– Edibles, packaged foods, daily essentials
- Hub-and-Spoke Distribution– Central warehouses feeding stores to keep supply chains lean (and hopefully shrinkage rates low)
They target value-conscious buyers who want brands without paying mall prices. The pricing strategy:be cheaper than the mall, but classier than the local bazaar.
4. Financials Overview
| Metric | Q1 FY26 | Q1 FY25 | Q4 FY25 | YoY % | QoQ % |
|---|---|---|---|---|---|
| Revenue (₹ Cr) | 3,140.32 | 2,596.00 | 2,548.00 | 20.95% | 23.25% |
| EBITDA (₹ Cr) | 459 | 366 | 357 | 25.41% | 28.57% |
| PAT (₹ Cr) | 206.07 | 150.00 | 115.00 | 37.38% | 79.19% |
| EPS (₹) | 0.44 | 0.33 | 0.25 | 33.33% | 76.00% |
Commentary:
- YoY growth across the board— even EBITDA margin inched up to 15%.
- QoQ explosion in PAT(+79%) — probably due to seasonal sales and higher operational leverage.
- EPS still under ₹1, but at this valuation, investors clearly expect ₹10 someday.
5. Valuation (Fair Value RANGE only)
Method 1: P/E Approach
- EPS (TTM) = ₹1.50
- Sector median P/E (ex-DMart hype) = ~40
- FV = 1.50 × 40 = ₹60
Method 2: EV/EBITDA
- FY25 EBITDA (TTM) = ₹1,624 Cr
- Sector median EV/EBITDA = 20 (retail premium)
- Net Debt ≈ ₹1,342 Cr (Borrowings ₹1,729 Cr – Cash ₹387 Cr)
- FV per share ≈ ₹90
Method 3: DCF (Basic)
- Avg FCF past 3 years ≈ ₹1,050 Cr
- Growth = 12% (aggressive retail expansion)
- Discount rate = 10%
- FV ≈ ₹110
Educational


