1. At a Glance
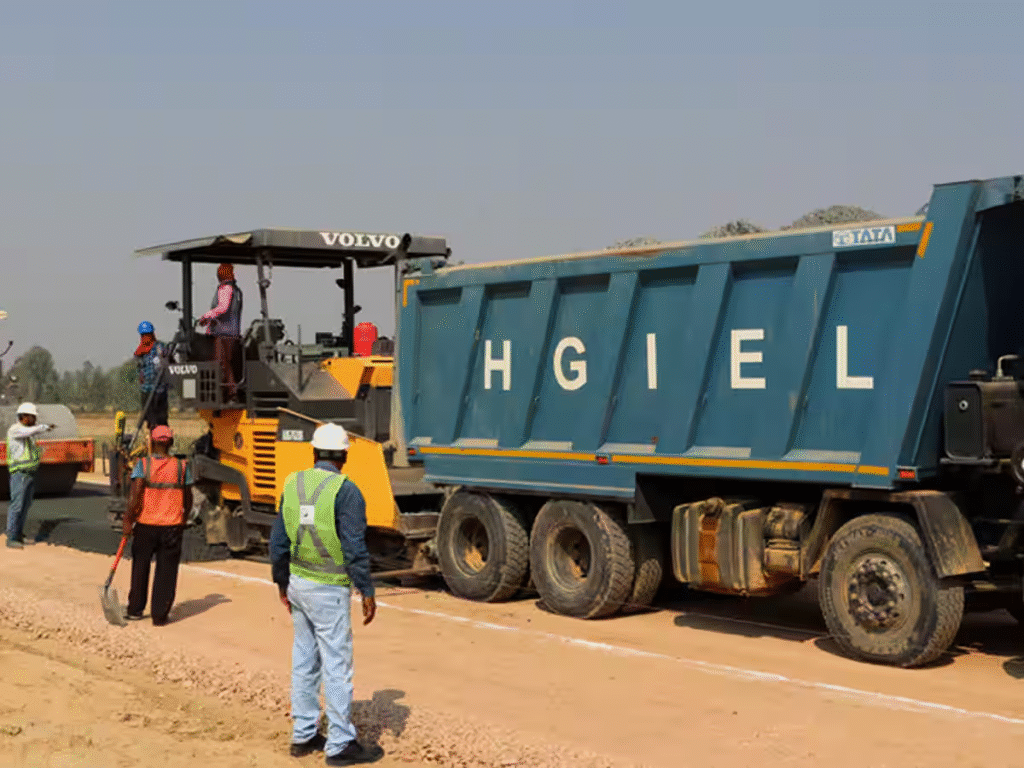
H.G. Infra is that infrastructure contractor who doesn’t just build roads — it builds entire cash highways. They just approved the sale of5 subsidiariesfor ₹3,584 crore to Neo Infra Fund (because sometimes it’s faster to sell a road than build one). With26 projects across 13 states, over3,000 pieces of equipment, and HAM/EPC contracts stacked like pancakes, they’ve managed to stay relevant even when the infra cycle turns moody.
2. Introduction
Think of H.G. Infra as the quiet middle-order batsman of Indian infra — not as flashy as L&T, but keeps scoring runs when it counts. From highways to metro projects, they’ve gone from local contractor to national player.
The big headline? They’re offloading five subsidiaries for more than half their current market cap. That’s not just a liquidity event — that’s a plot twist.
3. Business Model (WTF Do They Even Do?)
H.G. Infra makes and maintains:
- EPC road projects(their bread & butter)
- HAM projects(longer payback, but with annuity cash flows)
- Railways, metro lines, solar power, and water projects (because diversification is the infra version of “don’t put all your bricks in one basket”)
They’re EPC-heavy but keep HAM projects for annuity comfort. The sale of subsidiaries is likely part of a balance sheet clean-up + capital recycling plan.
4. Financials Overview
Quarterly Performance – Q1 FY26(₹ Cr)
| Metric | Latest Qtr (Jun’25) | YoY Qtr (Jun’24) | Prev Qtr (Mar’25) | YoY % | QoQ % |
|---|---|---|---|---|---|
| Revenue | 1,482 | 1,528 | 1,361 | -3.0% | 8.9% |
| EBITDA | 259 | 312 | 239 | -17.0% | 8.4% |
| PAT | 99 | 163 | 147 | -39.3% | -32.7% |
| EPS (₹) | 15.16 | 24.95 | 22.55 | -39.3% | -32.8% |
P/E ~15 — which is infra code for “we’re cheap unless your patience is expensive.”
Commentary: Revenue and
EBITDA took a YoY knock thanks to project mix and execution delays. PAT halved YoY — but this quarter’s “real” story is the subsidiary sale windfall ahead.
5. Valuation (Fair Value RANGE only)
Method 1 – P/E
- EPS (TTM): ₹67.77
- Applying 12x–18x range for EPC-heavy players → ₹813 – ₹1,220 FV range.
Method 2 – EV/EBITDA
- EBITDA (TTM): ₹1,005 Cr
- Net debt: ₹4,170 Cr borrowings – negligible cash = ~₹4,170 Cr
- EV ≈ ₹6,489 Cr mcap + ₹4,170 Cr = ₹10,659 Cr
- EV/EBITDA = 10.6x; fair range 9x–11x → FV ₹900 – ₹1,100/share
Method 3 – Post-Sale Adjusted Valuation
- Sale proceeds: ₹3,584 Cr
- If debt reduction applied, net debt could halve → valuation re-rate potential.
Educational FV Range (not advice): ₹900 – ₹1,200 pre-re-rating; post-sale could justify upper end.
6. What’s Cooking – News, Triggers, Drama
- Subsidiary sale for ₹3,584 Cr— closing in 12 months, debt reduction expected.
- Q1FY26 results: Soft


