1. At a Glance
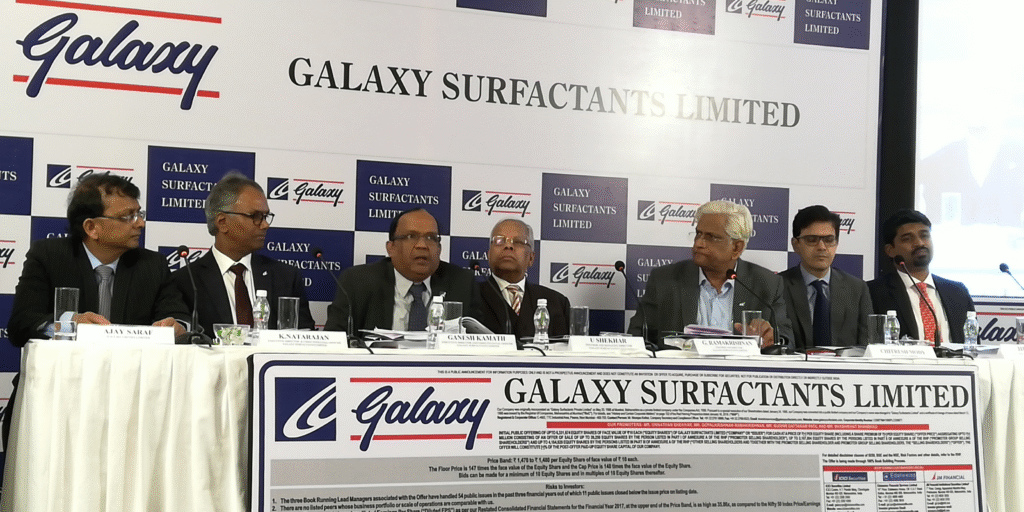
Galaxy Surfactants just posted Q1 FY26 numbers that look like a perfectly whipped shampoo lather — thick on top-line growth (+32% YoY revenue), but rinse away the foam and you’re left with flat earnings. EBITDA crawled up 4%, PAT refused to move an inch, and margins slipped a little. Still, they remain the MNC darling in surfactants, supplying every big FMCG name you’ve ever cleaned yourself with.
2. Introduction
Founded in 1986, Galaxy Surfactants is the chemical industry’s behind-the-scenes hero — they make the stuff that makes the stuff work. You’ll never see their logo on a shampoo bottle, but every time your face wash foams, or your dishwashing liquid smells like artificial lemons, Galaxy is silently cashing in.
They have over 215 products under two categories:Performance Surfactants(volume play, lower margins) andSpecialty Care Products(premium, high-margin). The holy grail? Push more volume into Specialty Care while keeping the base detergent chemicals churning.
3. Business Model (WTF Do They Even Do?)
- Performance Surfactants:Bulk materials like SLS and SLES — used in shampoos, body washes, detergents. Commodity-ish, but steady demand.
- Specialty Care Products:Conditioners, mild surfactants, pearlising agents — higher margins, brand loyalty from FMCG clients.
- Client Base:Unilever, P&G, Colgate, Dabur, Marico, and a bunch of regional players who sell “Herbal Shampoo” that’s 90% the same as the non-herbal one.
This is a B2B model with sticky contracts, high repeat business, and low marketing spend. But growth depends on FMCG sector health and global demand swings.
4. Financials Overview – Q1 FY26
| Metric | Q1 FY26 | Q1 FY25 | Q4 FY25 | YoY % | QoQ % |
|---|---|---|---|---|---|
| Revenue (₹ Cr) | 1,278 | 974 | 1,145 | 31.2% | 11.6% |
| EBITDA (₹ Cr) | 135.1 | 129.9 | 127.3 | 4.0% | 6.1% |
| PAT (₹ Cr) | 79.5 | 79.3 | 76.0 | 0.3% | 4.6% |
| EPS (₹) | 22.42 | 22.48 | 21.40 | -0.3% | 4.8% |
Commentary:
- YoY:Revenue popped thanks to higher export volumes and better product mix, but raw material costs and forex impacts kept net profit flat.
- QoQ:Margins improved slightly as input prices stabilised.
5. Valuation – Fair Value Range Only
a) P/E Method
- TTM EPS = ₹85.93
- Specialty chemical peer average P/E ~ 22–28x
- FV Range = ₹1,890 – ₹2,405
b) EV/EBITDA Method
- TTM EBITDA = ₹484 Cr
- Net Debt ≈ ₹210 Cr – Cash (~₹421 Cr) = Net Cash position.
- EV/EBITDA ~ 13–15x → FV ≈ ₹1,950 – ₹2,250
c) DCF Method(8% revenue CAGR, 15% EBITDA margin)
- FV ≈ ₹2,000
Fair Value Range:₹1,900 – ₹2,300Disclaimer: Educational purposes only, not investment advice.
6. What’s Cooking – News, Triggers, Drama
- Land disputestill ongoing — no provision made yet, because apparently legal problems solve themselves.
- Export-led growth— strong demand from Africa and the Middle East for both surfactants


