1. At a Glance
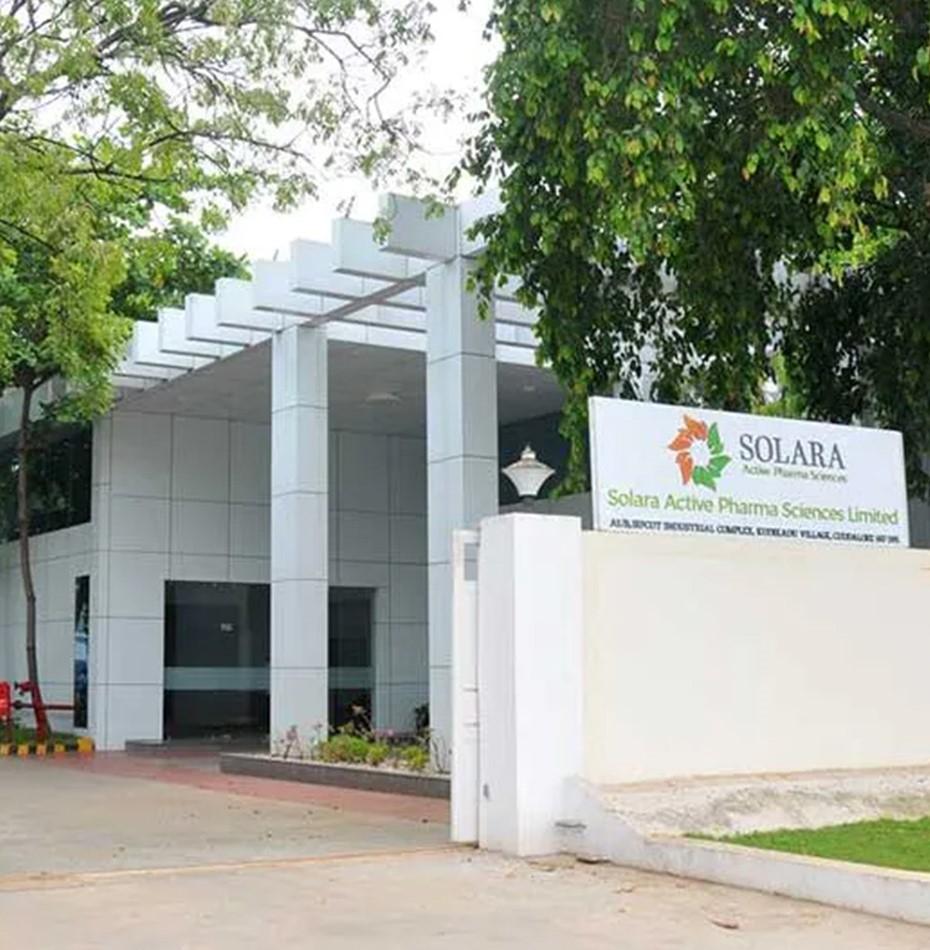
Solara Active Pharma just posted a profit after spending two years in “how low can we go” mode. From –₹567 Cr in FY24 to ₹10.5 Cr this quarter, they’re back in black—barely. The stock popped 6%, probably because no one died this time.
- Q1 FY26 PAT: ₹10.5 Cr
- Revenue: ₹319 Cr (+15% QoQ)
- OPM: 18%
- P/E: A jaw-dropping 5,708x (yes, even your calculator rolled its eyes)
2. Introduction with Hook
Picture a pharmaceutical Titanic that hit every iceberg from Sequent to Strides and still asked for dessert. Now, imagine that same ship found a lifeboat, patched up its hole, and waved at shareholders saying, “We good now?” That’s Solara for you.
- FY24 Loss: ₹567 Cr
- FY25: Tiny ₹1 Cr PAT
- Q1 FY26: ₹10.5 Cr profit — applause, confusion, and mild disbelief all around
3. Business Model (WTF Do They Even Do?)
Solara is in the pure-play API game, but with more drama than a Zee TV serial. They manufacture and export bulk drugs, serving 73+ countries and obsessing over 10 molecules that make up 84% of revenue.
Their APIs treat everything from parasites to paranoia (anthelmintics to anti-infectives), and they also do CRAMS work—because why not throw in more acronyms?
Think of it as B2B chemistry… just don’t ask where the “P” in profitability went the last few years.
4. Financials Overview
We finally got a quarter where the patient didn’t flatline.
| Metric | Q1 FY26 | Q4 FY25 | QoQ |
|---|---|---|---|
| Revenue | ₹319 Cr | ₹273 Cr | +15% |
| EBITDA | ₹57 Cr | ₹45 Cr | +26% |
| PAT | ₹10.5 Cr | ₹-2 Cr | Profit Resurrection |
| OPM | 18% | 17% | Slight rise |
FY25 TTM Stats:
- Revenue: ₹1,239 Cr
- Net Profit: ₹25 Cr
- ROCE: 6.01%
- ROE: 0.05% (technically positive, emotionally still negative)
5. Valuation
Ah yes, the valuation that makes even AI question the laws of finance.
- EPS TTM: ₹6.79
- P/E: 5,708x
- Why? Because FY24 EPS was –₹118.21
- Book Value: ₹304 → P/B = 2.36
Fair Value Range (if sanity returns):
- At 20x normalized EPS (~₹15): ₹300
- At 25x: ₹375
- FV Range: ₹300–₹375
So, unless they pull a “Dr Reddy’s in disguise” turnaround, this rally may be more relief than reason.
6. What’s Cooking – News, Triggers, Drama
- Q1 profit surprises everyone except the guy who forgot he still owns this stock
- ₹149 Cr Rights Issue fully utilized — mostly to repay debt
- Debt reduced by ₹143 Cr
- Plans for CRAMS demerger — classic pharma “let’s split and hope one of us does better” move
- CRO appointed (not Chief Rock Officer, sorry)
No FDA 483s or plant shutdowns = That’s a win in API land.
7. Balance Sheet
| Metric | FY25 | FY24 |
|---|---|---|
| Net Worth | ₹1,094 Cr | ₹934 Cr |
| Borrowings | ₹796 Cr | ₹1,012 Cr |
| Total Assets | ₹2,232 Cr | ₹2,351 Cr |
Observations:
- Debt trimmed down — hairline still intact
- Working capital cycle still long and cranky
- CAPEX bloated, returns delayed — it’s like waiting for Virar local at Churchgate
8. Cash Flow – Sab Number Game Hai
| Year | CFO | CFI | CFF | Net CF |
|---|---|---|---|---|
| FY25 | ₹213 Cr | ₹-37 Cr | ₹-180 Cr | ₹-4 Cr |
| FY24 | ₹109 Cr | ₹-4 Cr | ₹-106 Cr | ₹-0 Cr |
Good news:
- CFO strong again
Bad news: - CFF includes dilution, not discipline
Ugly: - Capex and R&D sucking liquidity like a toddler with a juice box
9. Ratios – Sexy or Stressy?
| Metric | FY25 | FY24 |
|---|---|---|
| ROE | 0.05% | -118% (yes.) |
| ROCE | 6.01% | -9% |
| D/E | 0.73 | 1.08 |
| OPM | 18% | 16% |
| Inventory Days | 185 | 163 |
Conclusion:
ROE is technically alive but might need a ventilator. D/E is improving, but CRAMS spin-off better deliver some CRAMming profits.
10. P&L Breakdown – Show Me the Money
| Year | Revenue | EBITDA | PAT |
|---|---|---|---|
| FY23 | ₹1,444 Cr | ₹134 Cr | ₹-22 Cr |
| FY24 | ₹1,289 Cr | ₹-95 Cr | ₹-567 Cr |
| FY25 | ₹1,239 Cr | ₹206 Cr | ₹25 Cr |
Insight:
FY24 was a pharmaceutical apocalypse. FY25 looks like the chemo worked. FY26? Call us when CRAMS gets listed.
11. Peer Comparison
| Company | Revenue (Cr) | PAT (Cr) | P/E | ROE |
|---|---|---|---|---|
| Sun Pharma | ₹52,578 | ₹11,454 | 35x | 16.8% |
| Cipla | ₹27,811 | ₹5,378 | 24x | 17.8% |
| Divi’s Lab | ₹9,360 | ₹2,190 | 80x | 15.4% |
| Solara Active | ₹1,239 | ₹25 | 5,708x | 0.05% |
Peer Verdict:
Solara is that one intern trying to stand with CEOs in the group photo. Hopeful, but slightly misplaced.
12. Miscellaneous – Shareholding, Promoters
| Category | Mar ’25 | Jun ’25 |
|---|---|---|
| Promoters | 37.94% | 42.01% (+4.07%) |
| FIIs | 14.63% | 14.25% |
| DIIs | 2.61% | 2.62% |
| Public | 44.82% | 41.10% |
Green flag alert: Promoters increased stake by 4%.
Public reduced exposure (somehow saw through the Q1 makeup)
FII/DII remained passive-aggressive.
13. EduInvesting Verdict™
Solara just gave us a rare profit, and investors clapped like a desi dad hearing “Beta got 60% after failing twice.” But let’s not get ahead of ourselves—it’s still a fragile recovery, CRAMS demerger is a wildcard, and cash flow is one bad quarter away from tears.
A comeback? Maybe. A compounding machine? Not yet.
Metadata:
Written by EduInvesting Team | 25 July 2025
Tags: Solara Active, Q1 FY26, API, Pharma Analysis, EduInvesting Premium
