V-Marc India Ltd: 61% Sales Growth, 43% Promoter Pledge – Wires Stronger Than Confidence?
Date of Publishing -
Spotted a factual error — a wrong number, date, or fact? Tell us and we will check the source.
1. At a Glance
V-Marc India started in 2014, got listed in 2021, and has since electrified investors with 905 Cr revenue in FY25 (+60% YoY). They make everything from PVC wires to HT cables (up to 66kV soon). On paper: ROE 24%, ROCE 26%, 3Y profit CAGR 93%. In reality: 43% of promoter shares pledged, debt ₹175 Cr, and capex binge ongoing. The business is wired, but are investors shock-proof?
2. Introduction
Let’s be honest. In India, cables are like Bollywood songs: hundreds come out every year, only a few get remembered. Polycab and KEI are the Arijit Singhs, RR Kabel the remix DJ, and V-Marc is that talented newcomer from a reality show — raw, fast-growing, but still struggling with confidence.
The market cap? ₹1,225 Cr. P/E? ~34 (industry 33). Buzz? “Mini Polycab” (every cable SME dreams of this title).
But with growth this sharp, the question is: are they pulling genuine copper, or just aluminium-wrapped hype?
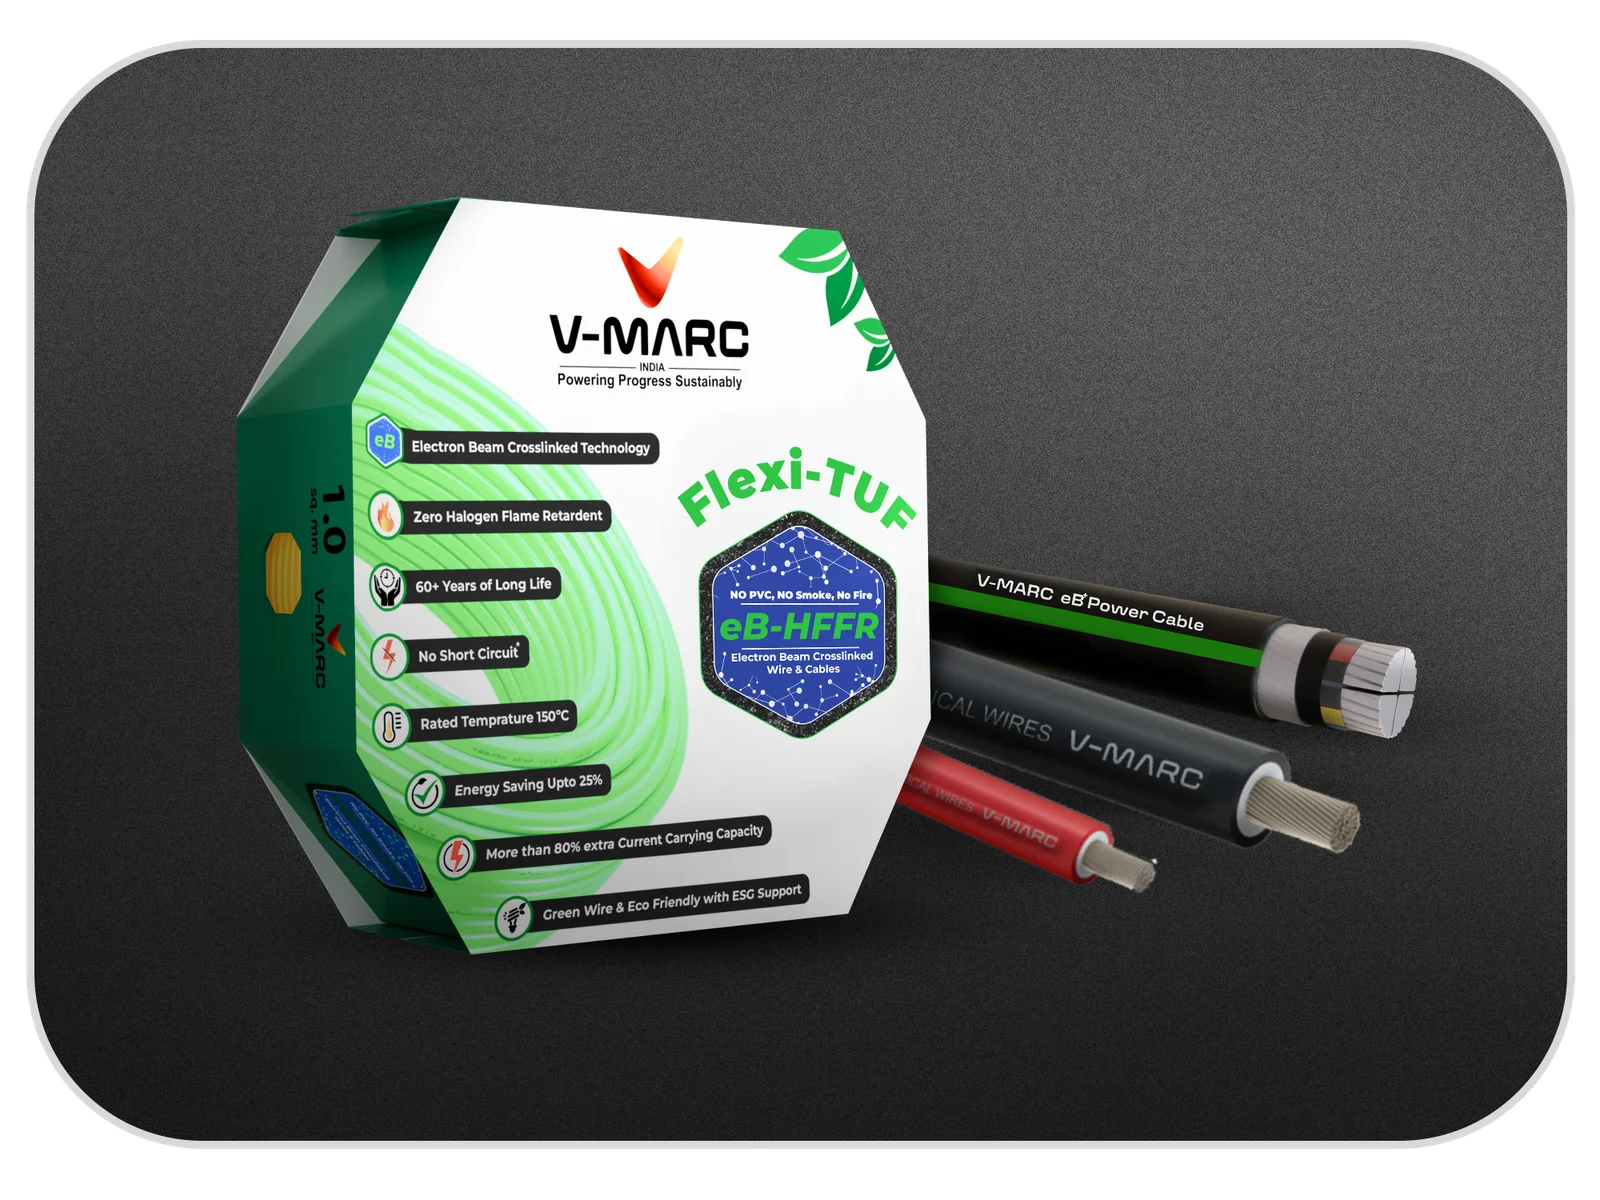
3. Business Model (WTF Do They Even Do?)
Core business = manufacturing wires & cables for:
LT Cables: PVC, XLPE, aerial bunched.
HT Cables: up to 33 kV, moving to 66 kV post-tech upgrade.
Communication Cables: CCTV, LAN, coaxial.
Light Duty Cables: fire-retardant, HRFR, FRLS, HFFR — basically jargon that convinces electricians and tender officers.
Clientele? Not small names: PowerGrid, NTPC, ONGC, IOCL, BSNL, GAIL. Translation = Government projects keep the current flowing.
Dealer Network = 600+ across 19 states. Retail + institutional mix (~70:30).