1. At a Glance
In an industry that usually ties knots in its financials, Usha Martin has decided to do the opposite—literally and metaphorically. With ₹887 Cr in revenue and ₹100 Cr in Q1 FY26 PAT, this steel wire rope specialist is showing more grip than a Spiderman stunt double. Oh, and did we mention? Net debt =zero.
2. Introduction: From Bankruptcy to Bondage (the Wire Kind)
Remember the 2010s when Usha Martin was a walking financial horror story? Bloated with debt, litigation drama thicker than Ekta Kapoor plots, and the kind of margins that made auditors weep. But here we are in 2025, and the company is basically flexing like it just got out of a transformation bootcamp—zero net debt, positive free cash flows, and consistently profitable.
Gone are the days when it sold its steel business just to survive. Now it’s all about high-margin wire ropes, specialty applications, and dominating global demand like it invented tensile strength. Also, they’ve been silently expanding globally with a sales mix that’s half exports—without shouting about it like a crypto bro on Twitter.
3. Business Model: WTF Do They Even Do?
Usha Martin is India’s wire-rope whisperer. The company manufactures and sells:
- Specialty wire ropes (used in elevators, mining, oil rigs, bridges, etc.)
- High carbon steel wires and strands
- Bespoke end-fittings and engineered rope solutions
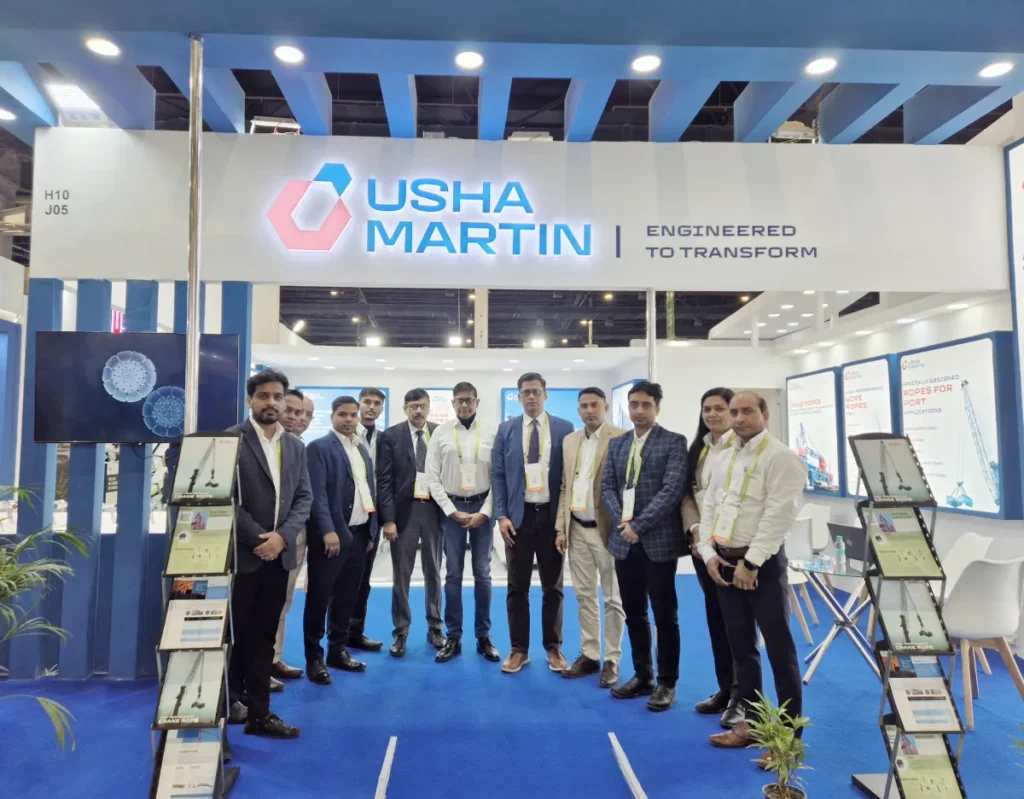
Their customers? Everyone from infrastructure players, construction companies, oil and gas majors to elevator OEMs. You name the sector, if it lifts, pulls or dangles—chances are Usha made the wire. With end-use cases ranging from deep mining in Australia to high-speed elevators in Europe, this isn’t your average “steel products” company—this is deep-tech metallurgy.
Bonus: They also make telecommunication cables, but let’s be honest, wire ropes are their main swag.
4. Financials Overview: From ‘OMG’ to ‘Ok Boss’
TTM Revenue: ₹3,535 CrTTM EBITDA: ₹588 CrTTM PAT: ₹403 CrEPS (FY25): ₹13.26Recalculated P/E: 26.4 (₹350 ÷ ₹13.26)YoY Revenue Growth: 7.4%YoY PAT Growth: Flat (but stable!)OPM: 17%ROCE: 19%ROE: 15.8%
Commentary: Margins are consistent, if not growing. While top-line growth isn’t
sprinting, it’s jogging without tripping. The biggest glow-up is that net debt has disappeared like your salary on Swiggy. We’ll allow the slow sales growth for now, because profitability has quietly become best-in-class in their category.
5. Valuation: Fair Value RANGE (Let’s Do Math, Baby)
Method 1: P/E Method
TTM EPS = ₹13.26Peer P/E Range = 18x (Jindal Saw) to 30x (Ratnamani)→ FV Range = ₹239 to ₹398
Method 2: EV/EBITDA
TTM EBITDA = ₹588 CrAssume EV/EBITDA range of 7x–10x → EV = ₹4,116 Cr to ₹5,880 CrNet Debt = 0Equity Value ≈ EVEquity Value per share = ₹265 to ₹379
Method 3: DCF
Assume:
- FY26 PAT = ₹420 Cr
- Growth: 10% CAGR for 5 years
- Terminal growth: 4%, Discount Rate: 13%→ DCF FV Range = ₹290 – ₹410
| Method | Fair Value Range (₹) |
|---|---|
| P/E | 239 – 398 |
| EV/EBITDA | 265 – 379 |
| DCF | 290 – 410 |
“This FV range is for educational purposes only and is not investment advice.”
6. What’s Cooking: News, Triggers, Drama
- Q1 FY26 results: Revenue up 7.4%, PAT ₹100 Cr, zero net debt.
- Legal battles: Ongoing litigations with former promoters (Jharkhand HC), but no financial impact.
- Stock Options: 1.66 lakh ESOPs granted under 2024 plan at a 20% discount.
- Export market:


