1. At a Glance
Transport Corporation of India (TCI) just delivered Q1 FY26 results that scream consistency: Revenue ₹1,139 Cr, EBITDA ₹121 Cr, and PAT ₹107 Cr. Stock trades at ₹1,195 with a P/E of 22. This isn’t a hype stock – it’s a steady, dividend-paying logistics warhorse with ROE nearing 20%.
2. Introduction
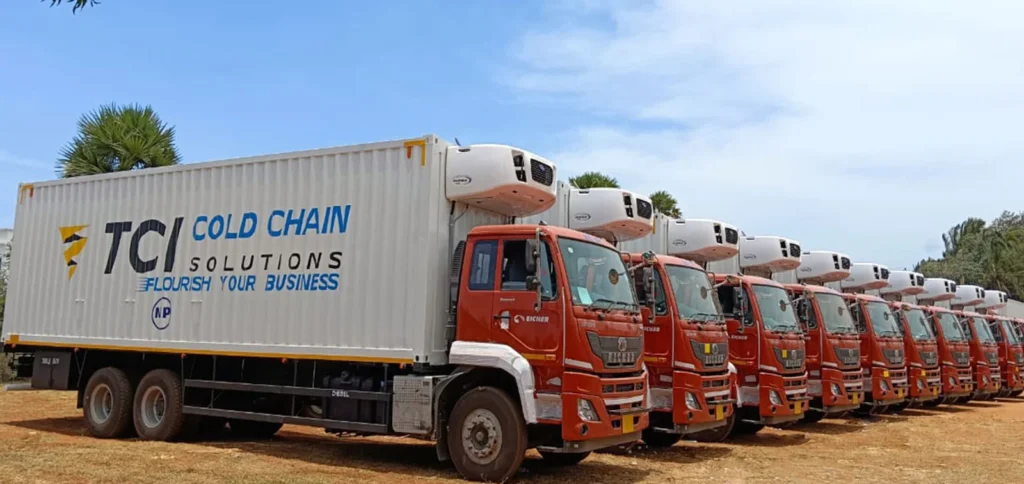
Think of TCI as the Swiss Army knife of logistics – road, rail, and sea – they move everything except maybe your hopes in penny stocks. While peers are chasing valuation bubbles, TCI keeps stacking profits like freight containers.
3. Business Model (WTF Do They Even Do?)
- Freight Transport – Trucks, fleets, and all that diesel drama.
- Supply Chain Solutions – End-to-end logistics for clients.
- Seaways Transport – They also own ships.
Bottom line: If it moves, TCI moves it… profitably.
4. Financials Overview
- Q1 FY26 Revenue: ₹1,139 Cr (+9% YoY)
- EBITDA: ₹121 Cr (+11.9%)
- Net Profit: ₹107 Cr (+17%)
- Margins: OPM 11%, PAT Margin 9.4%
Verdict: Stable growth, healthy margins, strong cost control.
5. Valuation – What’s This Stock Worth?
- Current P/E: 21.8x
- Fair Value Range (P/E 20–25x): ₹1,150 – ₹1,300
- EV/EBITDA Range: ₹1,100 – ₹1,250
Market pricing is fair; no bubbles here.
6. What-If Scenarios
- Bull Case: Trade volumes + supply chain demand → ₹1,400.
- Bear Case: Freight slowdown → ₹1,000.
- Base Case: ₹1,150–₹1,300 as long as growth stays above 10%.
7. What’s Cooking (SWOT Analysis)
Strengths: Multimodal network, strong promoter holding (69%), high ROE.
Weakness: Sales growth has been slow (10.6% 5-year CAGR).
Opportunities: SAARC trade expansion, e-commerce logistics boom.
Threats: Fuel costs, competition from Delhivery & VRL, global trade risks.
8. Balance Sheet 💰
| Particulars (Mar’25) | Amount (₹ Cr) |
|---|---|
| Equity Capital | 15 |
| Reserves | 2,139 |
| Borrowings | 242 |
| Total Liabilities | 2,780 |
| Total Assets | 2,780 |
| Commentary: Light debt, solid reserves – balance sheet is bulletproof. |
9. Cash Flow (FY23–FY25)
| Year | CFO (₹ Cr) | CFI (₹ Cr) | CFF (₹ Cr) |
|---|---|---|---|
| FY23 | 361 | -193 | -66 |
| FY24 | 299 | -404 | 18 |
| FY25 | 359 | -99 | -292 |
| Cash from operations is robust; capex and investments are well-managed. |
10. Ratios – Sexy or Stressy?
| Metric | Value |
|---|---|
| ROE | 19.8% |
| ROCE | 20.5% |
| D/E | 0.1 |
| PAT Margin | 9.4% |
| P/E | 21.8 |
| Punchline: Financials hotter than diesel prices. |
11. P&L Breakdown – Show Me the Money
| Year | Revenue (₹ Cr) | EBITDA (₹ Cr) | PAT (₹ Cr) |
|---|---|---|---|
| FY23 | 3,783 | 425 | 321 |
| FY24 | 4,024 | 411 | 354 |
| FY25 | 4,492 | 463 | 416 |
| Clear upward trajectory, no volatility drama. |
12. Peer Comparison
| Company | Rev (₹ Cr) | PAT (₹ Cr) | P/E |
|---|---|---|---|
| Container Corp | 8,887 | 1,314 | 34 |
| VRL Logistics | 3,161 | 177 | 30 |
| TCI | 4,586 | 432 | 22 |
| TCI wins on ROE and valuation sanity; peers are either overhyped or underperforming. |
13. EduInvesting Verdict™
TCI is the tortoise in the logistics race – slow and steady but consistently winning. For investors, it’s a safe pit stop in a volatile market. Not flashy, not fragile – just quietly compounding wealth.
Written by EduInvesting Team | 28 July 2025
Tags: Transport Corporation of India, Logistics, Q1 FY26 Results, EduInvesting Premium


