At a Glance
Thermax Limited just dropped a Q1 FY26 earnings bombshell – revenue at ₹2,150 Cr, PAT ₹151 Cr (up 39% YoY), and order bookings up 7%. The market loves a growth story, but here’s the kicker: it’s trading at a P/E of 70.3 – pricier than a Starbucks latte in Switzerland. The stock sits at ₹3,940, far below its 52-week high of ₹5,721. The environment solutions giant is flexing order book strength, but is the valuation running hotter than its own boilers? Time to dig.
Introduction
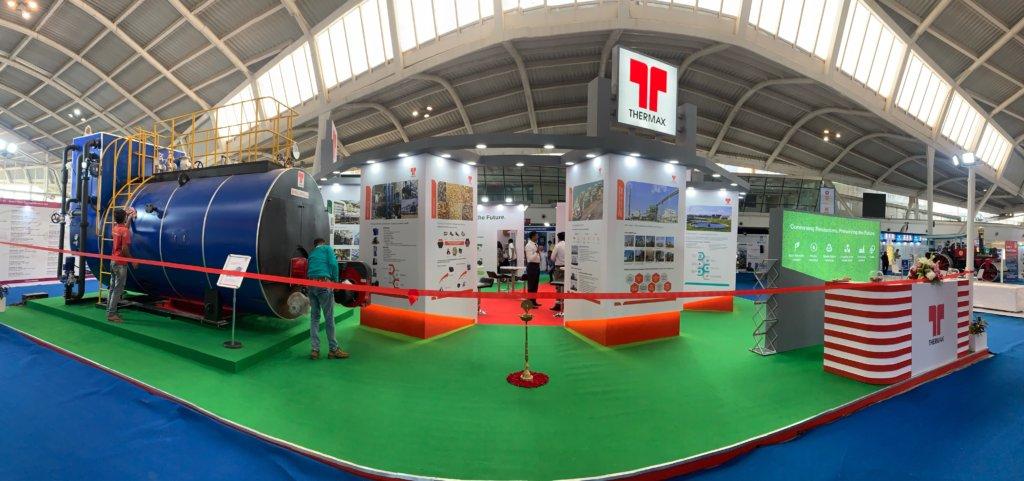
Thermax, the OG of clean energy and industrial solutions, has been quietly doing the heavy lifting in India’s energy and environment space. Boilers, chillers, solar, water treatment – they make everything your factory needs except snacks. In Q1 FY26, despite a 1.5% dip in revenue YoY, profits shot up thanks to margin discipline and a sprinkle of other income magic. However, with a market cap kissing ₹47,000 Cr and FIIs slowly increasing their holding, the stock looks like it’s priced for perfection – perfection that may or may not arrive.
Business Model (WTF Do They Even Do?)
Thermax sells energy solutions, pollution control systems, water and waste management plants, solar gear, and chemicals. The revenue comes from:
- Industrial Products (40%) – small boilers, pollution control, chillers.
- Environment Solutions – air and water treatment.
- Chemical & Services – performance chemicals, ion exchange resins.
- Renewables & EPC – power plants, solar EPC projects.
Their clients? Heavy industries like cement, metal, F&B, and power. The company’s USP: sustainability solutions that actually work. Roast: while they make equipment to cut emissions, their investors emit a lot of anxiety during earnings.
Financials Overview
Q1 FY26 Performance
- Revenue: ₹2,150 Cr (↓1.5% YoY)
- Operating Profit: ₹225 Cr (OPM 10%)
- PAT: ₹151 Cr (↑39% YoY)
- EPS: ₹12.8
TTM EPS: ₹56.3 → Fresh P/E = ₹3,940 / ₹56.3 ≈ 70.
Margins improved, but the sales dip shows order execution volatility. For FY25, revenue was ₹10,389 Cr, PAT ₹627 Cr.
Valuation
Time to pop the calculator:
- P/E Method:
- Sector P/E ~ 40
- EPS FY26E ~ ₹65
- Fair Price = 65 × 40 = ₹2,600
- EV/EBITDA:
- EBITDA FY25 ~ ₹910 Cr
- EV/EBITDA ~ 20x (sector)
- EV ~ ₹18,200 Cr → Price ~ ₹3,200
- DCF (Quick & Dirty):
- Assume FCF ₹600 Cr, growth 10%, terminal 4%, WACC 11%
- Fair Value ≈ ₹3,000–3,300
Fair Value Range: ₹2,600–3,300. Current ₹3,940 is above comfort zone. This stock’s valuation is like your gym fees – high, and you still hope it pays off.
What’s Cooking – News, Triggers, Drama
- Order booking up 7% – good pipeline visibility.
- Subsidiary FEPL invested ₹84 Cr in renewables – green push continues.
- Management change – senior leader retiring; watch for leadership transitions.
- FIIs increasing stake – smart money sniffing long-term gains.
- Macro tailwinds – government push for clean energy and pollution control is a booster.
Balance Sheet
| Particulars (₹ Cr) | FY24 | FY25 |
|---|---|---|
| Assets | 10,141 | 12,008 |
| Liabilities | 10,141 | 12,008 |
| Net Worth | 4,440 | 4,937 |
| Borrowings | 1,277 | 1,718 |
Auditor’s Roast: Healthy equity, rising borrowings – they’re playing it safe, but leverage is creeping up like that extra kilo after Diwali.
Cash Flow – Sab Number Game Hai
| ₹ Cr | FY23 | FY24 | FY25 |
|---|---|---|---|
| Operating | 460 | 247 | 1,043 |
| Investing | -664 | -514 | -1,220 |
| Financing | 349 | 285 | 124 |
Commentary: Ops cash surged in FY25, but investing cash outflows show they’re spending aggressively (renewables, capacity). Financing inflows slowing down – no debt binge yet.
Ratios – Sexy or Stressy?
| Ratio | Value |
|---|---|
| ROE | 13.4% |
| ROCE | 16.2% |
| P/E | 70.3 |
| PAT Margin | 10% |
| D/E | 0.35 |
Commentary: ROE/ROCE decent, debt low. But P/E? Let’s just say this is the Tesla of industrials in India.
P&L Breakdown – Show Me the Money
| ₹ Cr | FY23 | FY24 | FY25 |
|---|---|---|---|
| Revenue | 8,090 | 9,323 | 10,389 |
| EBITDA | 601 | 797 | 910 |
| PAT | 451 | 643 | 627 |
Joke: Revenue grows, profit grows, stock falls (down 22% YoY). Market logic is like Indian traffic – makes no sense but somehow works.
Peer Comparison
| Company | Rev (₹ Cr) | PAT (₹ Cr) | P/E |
|---|---|---|---|
| ABB India | 12,267 | 1,889 | 62 |
| Siemens | 17,506 | 1,879 | 58 |
| CG Power | 10,559 | 996 | 105 |
| Thermax | 10,354 | 669 | 70 |
Remark: Thermax is priced richer than ABB/Siemens despite smaller earnings. Market’s betting on its clean energy play.
Miscellaneous – Shareholding, Promoters
Promoters hold a stable 61.99%, FIIs increased to 16%. DIIs trimmed. Public floats at 4.7%. High institutional interest suggests confidence, but also means they can dump anytime.
EduInvesting Verdict™
Thermax is a clean energy and industrial giant with a proven track record of growth, margin improvement, and sustainability-focused solutions. Q1 FY26 showed strong PAT growth (up 39%), healthy order book, and stable promoter confidence. However, revenue decline YoY and sky-high valuation (P/E 70) make it a risky bet for value seekers.
SWOT
- Strength: Strong order book, diversified solutions, green energy pivot.
- Weakness: High valuation, modest ROE.
- Opportunity: Government clean energy push, global demand for pollution control.
- Threat: Execution delays, raw material cost spikes, global slowdown.
For long-term investors with patience (and nerves), Thermax could be a solid hold. For bargain hunters, wait for a better entry – the boilers may need to cool down first.
Written by EduInvesting Team | 31 July 2025SEO Tags: Thermax, Q1 FY26 Results, Industrial Equipment Stocks, Clean Energy Solutions

