Themis Medicare FY26: Profit Craters, Margins Vanish, API Traction Fades
General information and entertainment, not investment advice. The author is not a SEBI-registered adviser or research analyst. No recommendation, no promised returns. Markets carry risk including loss of capital. Figures may not be current. Consult a registered adviser before acting.
1 — At a Glance
Profit crashed 96% to ₹1.14 crore. Revenue fell 15.6% to ₹342.24 crore. EBITDA margin collapsed from 12.1% to 0.1%. Three loss quarters (Q1–Q3) preceded a Q4 bounce (₹8.89 Cr PAT). Net worth ₹398.58 Cr, D/E 0.25x held, but Acuité downgraded ratings June 8 citing stretched liquidity. A ₹13.32 Cr tax demand hangs pending appeal. Does recovery stick or was Q4 one-quarter noise?
2 — Introduction
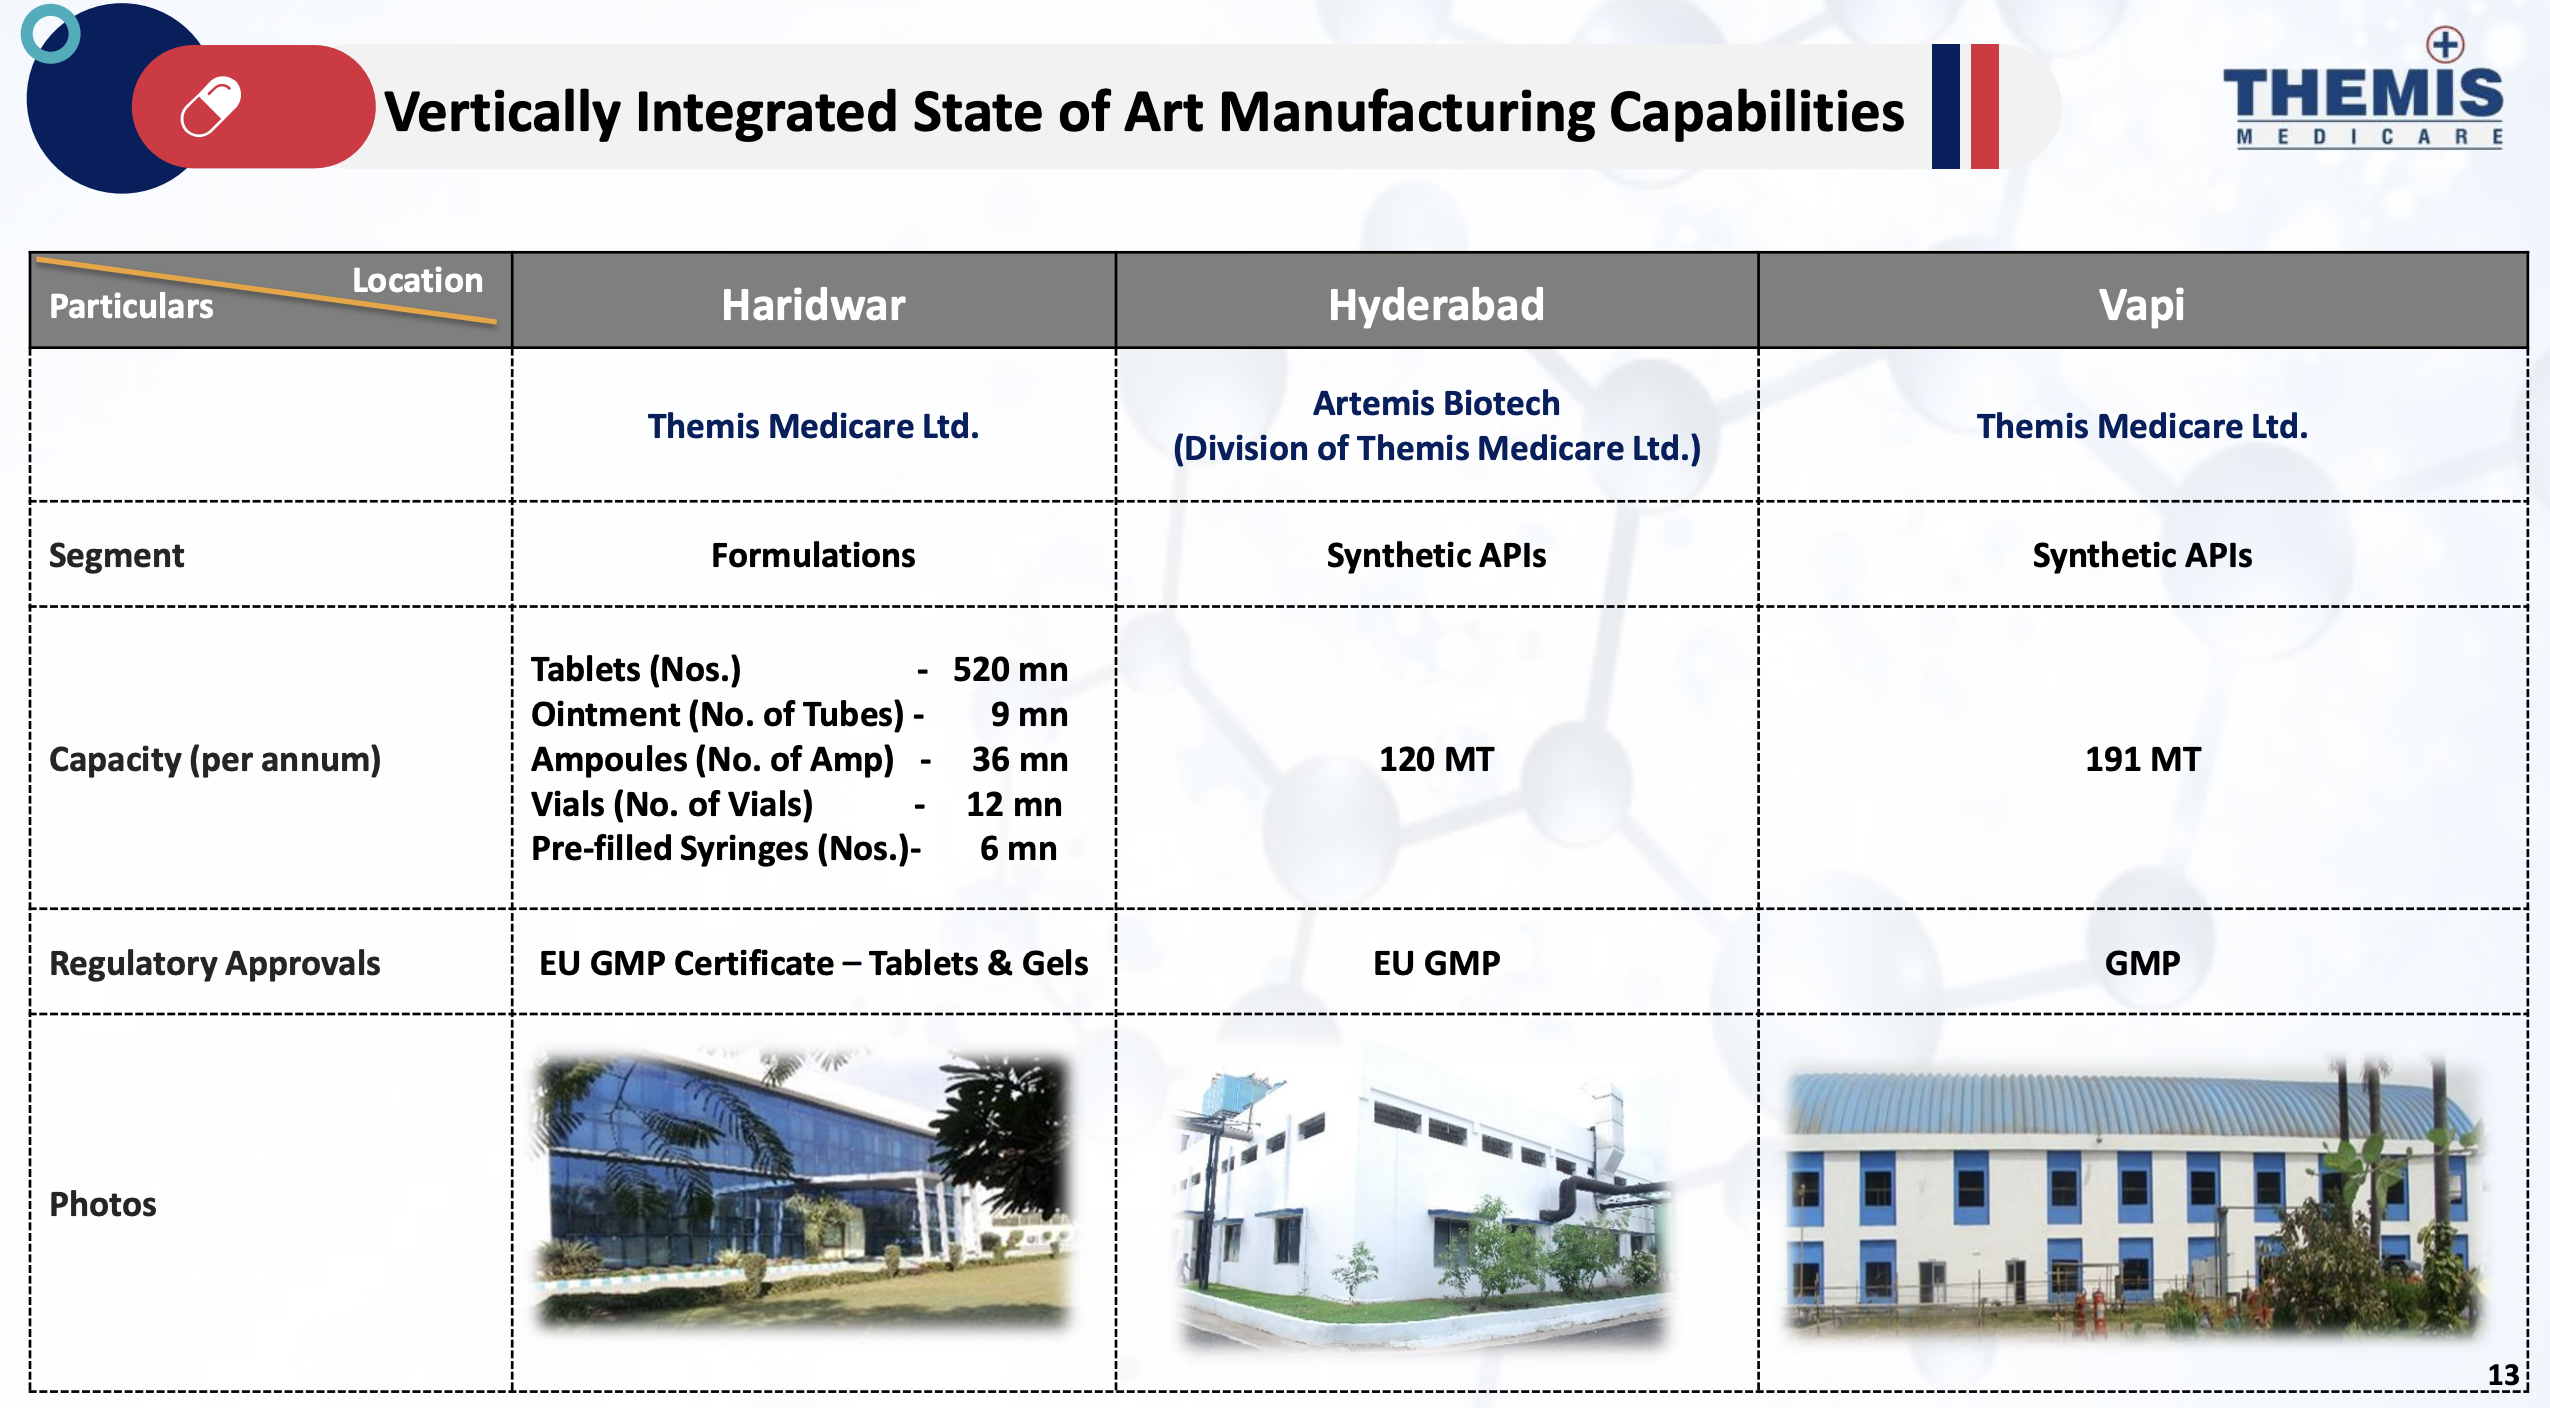
Themis Medicare was founded in 1969 as a joint venture between Gujarati promoters and Gedeon Richter Plc (Hungary). The company manufactures formulations and active pharmaceutical ingredients (APIs)—antiseptics, anti-TB, anti-malarial, anti-cholesterol, pain management drugs—and operates three manufacturing sites (Haridwar for formulations, Hyderabad and Vapi for APIs).
The company has spent the past two years in structural change. It withdrew a proposed merger with associate Gujarat Themis Biosyn in June 2025 and abandoned a demerger plan, choosing instead to “focus on core businesses.” Management brought in a new leadership team for the Formulations segment in FY26, closed the Company Secretary role mid-quarter (February 2026), and began restructuring distribution toward hospital chains.
On March 27, 2026, promoters Vividhmargi and related parties passed a postal ballot approving: issuance of ₹47.27 crore in convertible warrants at ₹102.87 per warrant; an inter-se transfer of ₹130 crore within group entities; and shareholder approval to raise equity capital. The moves signal capital strain and group consolidation.
3 — Business Model: WTF Do They Even Do?
Themis makes critical care injectables, antibiotics, and bulk chemicals—the nuts-and-bolts of hospital pharmacies and API customers.
Three revenue wings.
Hospital Business (49% of FY26 revenue, ₹171 crore): Supplies critical care and intensive care injectables to hospital chains and nursing homes. Product portfolio spans anesthesia, wound management, anti-infection. High margin but slow, relationship-driven sales cycle—hospitals vet suppliers over months. The segment grew during FY26 despite overall contraction, showing that chain hospital wins offset losses elsewhere.
Trade Business (26%, ₹89 crore): Branded formulations sold through chemists and doctors—proton pump inhibitors, anti-allergens, NSAIDs, anti-malarials. The face of the company to the street. This business cratered in FY26 as sales force restructuring, competitive pricing pressure, and product portfolio shifts tangled up coverage. By year-end, management claimed “improved field force productivity” but the damage was visible in the numbers.
API, Co-Marketing & Others (25%, ₹86 crore): Active pharmaceutical ingredients (bulk drugs) sold to pharma companies, plus contract manufacturing and exports to 44+ countries. Management says discussions on new molecules remain “encouraging” but existing product sales kept healthy traction—a rare bright spot. The risk: APIs are commodity-like, margin-thin, and exposed to counterfeit and Chinese dumping pressure.
The company has R&D pipelines: 5–8 new APIs and 20–24 formulations delivered per year; 3–5 APIs and 31 formulations rolling in development. Capacity includes 520 million tablet units, 9 million ointment tubes, and 191 metric tonnes of synthetic API per year—idle space when sales drop.
Why is the model creaky? Formulations require doctor trust and chemist stocking—a slow, fragmented market where Themis has no scale advantage over Sun Pharma or Cipla. APIs are vulnerable to Chinese pricing and quality scandals. Hospitals want integrated suppliers with deep product portfolios, inventory management, and relationship managers—expensive to build and easy to lose on one credit issue or a rival’s quarterly discount.
4 — Financials Overview
Figures are consolidated, in ₹ crore.
Quarterly Results (Latest: Q4 FY26)
Metric
Q4 FY26
Q4 FY25
YoY
Q3 FY26
QoQ
Revenue
76.53
71.70
+6.7%
90.13
-15.1%
EBITDA
3.76
-5.78
+165%
9.80
-61.6%
PAT
8.89
-9.66
+192%
10.09
-11.9%
EPS (₹)
0.96
-1.05
—
1.10
-12.7%
Q4 saw modest revenue growth (6.7% YoY) driven by API traction and hospital business gains. EBITDA swung positive (₹3.76 crore, 4.9% margin vs. -8% in Q4 FY25), thanks to employee cost cuts and operational efficiencies. But the recovery was narrow: Q4 revenue fell sequentially from Q3, and full-year momentum remained broken.
Annual Results (FY26 vs FY25)
Metric
FY26
FY25
YoY
Revenue
342.24
405.51
-15.6%
EBITDA
0.39
49.05
-99.2%
PAT
1.14
29.83
-96.2%
EPS (₹)
0.12
3.24
-96.3%
The full-year story is losses in Q1, Q2, Q3 offsetting profits in Q4. Other income (₹22.54 crore, mostly interest on cash and investments) masked the weakness: without it, pre-tax profit would have been sharply negative.
From Management (Investor Presentation, May 28, 2026):
Dr. Sachin Patel, MD & CEO:
“The Company witnessed a gradual recovery in profitability during Q4 FY26. Consolidated revenue for the quarter stood at ₹76.5 crore, registering a growth of 6.7% YoY, supported by improvement across key business segments. EBITDA for the quarter improved significantly to ₹3.8 crore as against a loss of ₹5.8 crore in Q4 FY25, while EBITDA margin expanded to 4.9% driven by operational efficiencies.”
Translation: We stemmed the bleeding, not reversed it.
“The Formulation business continued to undergo strategic restructuring under the new leadership team with focus on improving market positioning, enhancing product mix, and driving sustainable growth.”
Translation: We hired new leaders, fired people, and shut underperforming SKUs.
“The API business continued to witness healthy traction in existing molecules, while discussions for new products remain encouraging.”
Translation: Old APIs held, new deals in talk phase.
“R&D investments remained consistent at around 3% of revenue, reflecting the Company’s commitment towards developing differentiated products and strengthening its long-term pipeline.”
R&D spend FY26: ₹11.32 crore on ₹342.24 crore revenue = 3.3%. In FY25, it was ₹13.21 crore on ₹405.51 crore = 3.3%. The percentage held because both numerator and denominator fell.
5 — Valuation Discussion: Fair Value Range (Educational Only)
What follows is a walkthrough of how three valuation methods work, using this company’s numbers as the example — not a target, not a forecast, not advice.