1. At a Glance
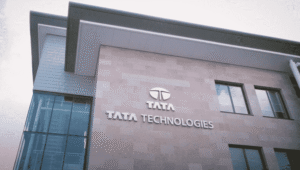
Global engineering services player from the Tata stable, offering outsourced R&D, EV vehicle design, and digital transformation services. The problem? Everyone thinks it’s Tata Motors’ younger nerdy cousin… but this cousin has a 26% ROCE, minimal debt, and solid global clients.
2. Introduction with Hook
Imagine if Tony Stark outsourced the making of Iron Man suits to India – Tata Technologies would be the vendor he’d call. From designing EVs for Southeast Asian unicorns to digitally transforming factories, this company is building the backbone of future tech.
- PAT for FY25: ₹677 Cr
- ROCE: 26%, with minimal debt
- Dividend payout? A chill 70% (Tata style wealth sharing)
But here’s the zinger – the stock fell nearly 37% from its ₹1,136 IPO high. So is this dip your engineering marvel or just another midcap mirage?
3. Business Model (WTF Do They Even Do?)
Core Engine: Engineering + Digital Services
- 78% of revenue comes from outsourced engineering, product development, EV design & software-defined vehicle (SDV) support.
- Key Clients: OEMs in auto, aerospace, and industrial machinery (think global names with NDAs attached).
- Digital Wing: Smart manufacturing, simulation, PLM, IoT integration.
Tata Technologies is not a factory — it’s the brain of the factory.
4. Financials Overview
YoY PAT Growth: 5.1%
Revenue (FY25): ₹5,144 Cr
PAT (FY25): ₹677 Cr
Operating Margin: 18% stable across years
Quarterly Q1 FY26 Update (June 2025):
- Revenue: ₹1,244 Cr
- PAT: ₹170 Cr
- EPS: ₹4.19
- Special Dividend: ₹474.63 Cr (yes, seriously)
3-Yr Sales CAGR: 14%
3-Yr PAT CAGR: 16%
Debt: Laughably low
5. Valuation
Current Price: ₹717
Market Cap: ₹29,101 Cr
P/E: 42.5
Book Value: ₹88.2
Let’s slap on some sanity here. Based on peer multiples, DCF, and historicals:
| Method | Fair Value Range |
|---|---|
| DCF (base) | ₹690–₹760 |
| P/E-Based (industry avg 35x) | ₹580–₹715 |
| EV/EBITDA (industry 20x) | ₹650–₹770 |
🧠 EduFair™ Valuation Range: ₹680–₹740
6. What’s Cooking – News, Triggers, Drama
- Strategic Client Wins: 6 new wins in Q1 FY26
- SDV Projects completed for a SEA EV client
- Low CapEx Needs = high FCF potential
- Special Dividend Drama worth ₹474 Cr—investors were left dizzy
- FOMO IPO Fatigue: From ₹1,136 to ₹717, stock corrected 37%
- Zero-debt ambitions + potential EV boom exposure
7. Balance Sheet
| Particulars (₹ Cr) | FY23 | FY24 | FY25 |
|---|---|---|---|
| Equity Capital | 81 | 81 | 81 |
| Reserves | 2,908 | 3,140 | 3,498 |
| Total Borrowings | 255 | 257 | 237 |
| Other Liabilities | 1,957 | 2,100 | 2,848 |
| Total Assets | 5,201 | 5,578 | 6,664 |
Key Points:
- Debt negligible at ₹237 Cr
- Reserves consistently growing
- No CWIP (work-in-progress) nonsense
8. Cash Flow – Sab Number Game Hai
| Particulars (₹ Cr) | FY23 | FY24 | FY25 |
|---|---|---|---|
| Cash from Ops | 401 | 294 | 699 |
| Cash from Investing | -440 | 400 | -65 |
| Cash from Finance | -347 | -557 | -486 |
| Net Cash Flow | -385 | 137 | 148 |
Key Insights:
- FCF positive
- Capex-light model = happy balance sheet
- Financing cash outflows = dividend generosity
9. Ratios – Sexy or Stressy?
| Metric | FY23 | FY24 | FY25 |
|---|---|---|---|
| ROCE | 28% | 28% | 26% |
| ROE | 22% | 21% | 20% |
| OPM | 19% | 18% | 18% |
| Payout | 80% | 60% | 70% |
| Debtor Days | 91 | 82 | 71 |
Verdict: ROCE still flexing like it’s 2021. No stress signs. No leverage monkey on the back.
10. P&L Breakdown – Show Me the Money
| Metric | FY23 | FY24 | FY25 |
|---|---|---|---|
| Revenue | ₹4,414 Cr | ₹5,117 Cr | ₹5,168 Cr |
| Expenses | ₹3,593 Cr | ₹4,176 Cr | ₹4,234 Cr |
| EBITDA | ₹821 Cr | ₹941 Cr | ₹934 Cr |
| Net Profit | ₹624 Cr | ₹679 Cr | ₹677 Cr |
Key Observations:
- Flat top-line in FY25, but high profitability sustained
- Engineering firms don’t scale like SaaS, but this one’s doing fine
11. Peer Comparison
| Company | CMP | P/E | ROCE | ROE | OPM | Sales (TTM) | PAT (TTM) |
|---|---|---|---|---|---|---|---|
| Tata Tech | ₹717 | 42.5 | 25.8% | 19.9% | 18% | ₹5,144 Cr | ₹685 Cr |
| L&T Tech | ₹4,347 | 36.5 | 28.3% | 22.1% | 17.7% | ₹10,670 Cr | ₹1,260 Cr |
| Affle | ₹1,967 | 72.4 | 16.8% | 14% | 21.3% | ₹2,266 Cr | ₹381 Cr |
| Inventurus | ₹1,590 | 56.1 | 27.2% | 32.9% | 28.8% | ₹2,663 Cr | ₹486 Cr |
| Netweb | ₹1,982 | 98.1 | 32.5% | 24% | 13.9% | ₹1,149 Cr | ₹114 Cr |
Summary: Tata Tech is not the cheapest, but it’s the most mature & stable. A strong midcap bracket contender.
12. Miscellaneous – Shareholding, Promoters
| Category | Mar 2025 |
|---|---|
| Promoter | 55.22% |
| FIIs | 3.10% |
| DIIs | 2.48% |
| Public | 39.20% |
| Total Shareholders | 13.7 Lakh |
Notable:
- Promoters continue holding majority stake
- Retail shareholder base widening (13+ lakh holders!)
- FII + DII interest slowly creeping up
13. EduInvesting Verdict™
Tata Technologies is that rare IT-engineering hybrid that’s not trying to become the next TCS but is content being the brains behind the machines. It doesn’t scream growth like a startup, but it whispers stability like an old Tata truck.
- Strong global client base
- Minimal debt
- Stable margins
- High dividend yield
- Valuation slightly elevated, but justified for long-term moats
The company is quietly building the future of mobility and manufacturing. Just don’t expect it to moon tomorrow. This one’s for believers in boring compounding with Tata DNA.
Metadata
Written by EduInvesting Analyst | 14 July 2025
Tags: Tata Technologies, Engineering Services, IPO, EV Design, Digital Manufacturing, Midcap IT, Dividend Stocks, Tata Group
