Tamil Nadu Petro Products Mar 2026: The 72.6% Quarterly Sales Collapse vs A 104% Annual Profit Spike
Section 1 — At a Glance
Tamil Nadu Petroproducts Ltd (TPL) closed its fiscal year ending March 31, 2026, presenting a massive divergence between structural annual improvements and a severe, localized final-quarter crunch. Annual revenue for FY26 stood at ₹1,466.14 crore, down nearly 20% from ₹1,826.78 crore in FY25, primarily dragged down by an unprecedented deceleration in the final quarter. Despite this top-line contraction, full-year net profit jumped to ₹97.45 crore, representing a 67% increase compared to the ₹58.35 crore recorded in the previous fiscal year. The engineering of this bottom-line growth was aided by raw material cost deflation over the broader nine-month period, alongside the operational cushion provided by a five-year anti-dumping duty on imports from Iran and Qatar.
Investor attention is currently fixed on TPL’s major technological and capacity overhaul at its Manali facilities. The transition from legacy mono-polar to energy-efficient bipolar membrane technology in the caustic soda unit promises structural margin support once fully online. However, the immediate cost of this transition has arrived in the form of a heavily constrained final quarter, marked by a planned integration shutdown and sudden raw material supply disruptions. While the balance sheet retains a robust cash buffer of ₹343.60 crore, the sudden expansion of borrowings to ₹464.75 crore highlights the capital intensity of its recent execution cycle. Earnings quality is highly dependent on commodity cycles, meaning that margin expansions driven purely by regulatory protection can vanish as rapidly as they appear. The core question is whether the commissioned capacities can stabilize before baseline market dynamics shift.
Section 2 — Introduction
Tamil Nadu Petroproducts Ltd, established in 1984 as a joint venture between SPIC Ltd and the state-owned TIDCO, operates as a critical chemical supplier in the domestic surfactant ecosystem. Positioned as the sole manufacturer of Linear Alkyl Benzene (LAB) in South India, the company commands a significant 23% share of domestic production capacity. Its operational footprint includes three interconnected petrochemical blocks located in the industrial cluster of Manali, Chennai.
This review comes at a vital operational junction for the firm. TPL has just completed a ₹639 crore capital expenditure cycle aimed at expanding its chemical volumes and reducing its structural power costs. However, the execution of these long-term upgrades has directly collided with near-term supply chain constraints and unplanned force majeures. This analysis strips away the macro noise to examine whether the stock’s current valuation honors its enhanced asset base, or if the final quarter’s breakdown is a warning of deeper logistical vulnerabilities.
Section 3 — Business Model: WTF Do They Even Do?
TPL is essentially the backbone of your morning laundry routine, though you have never seen their name on a bottle. They run a highly commoditised B2B operation focused on three core chemical blocks: Linear Alkyl Benzene (LAB), Caustic Soda, and Propylene Oxide (PO).
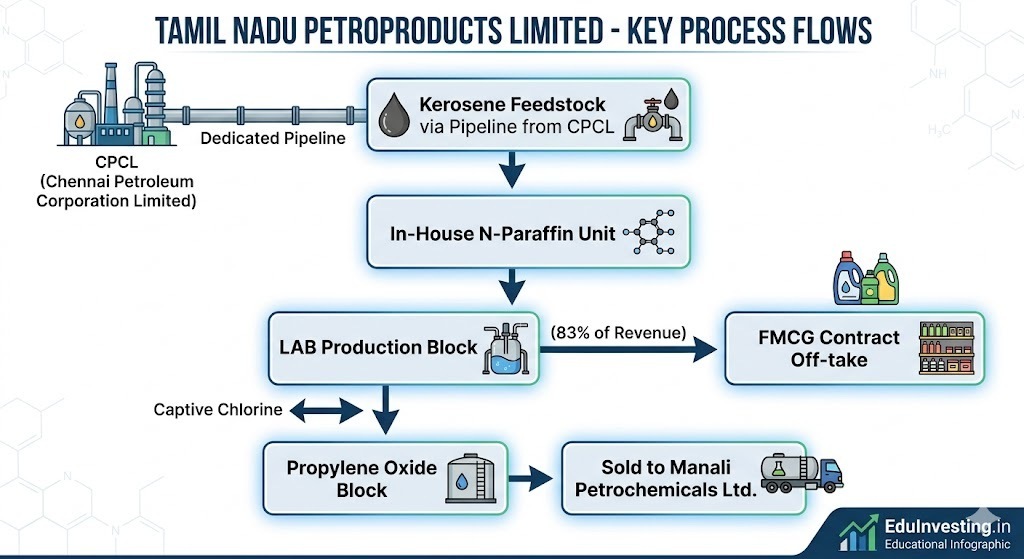
The cash cow is LAB, sold under the brand name “SUPERLAB,” which accounts for roughly 83% of total revenue. LAB is the primary active surfactant used by FMCG giants to produce domestic detergents and industrial cleaners. TPL locks these clients into annual off-take contracts where prices are adjusted monthly based on international crude derivatives like benzene and kerosene. To save on freight, their plant sits right next to Chennai Petroleum Corporation Limited (CPCL), sucking kerosene directly through a dedicated pipeline to run their own N-Paraffin unit. The remaining revenue is split between Caustic Soda (used in paper and aluminium processing) and Propylene Oxide, which is largely sold to group entity Manali Petrochemicals.
The quarterly table looks like an absolute train wreck, and for a very distinct reason. Top-line revenue collapsed by over 72% year-on-year, tumbling to ₹124.50 crore. When a manufacturing plant stops producing, fixed depreciation costs eat your operating