1.At a Glance
Suraj Products Ltd, the Sundargarh-based iron alchemist, just turned in a quarter that can only be described as “rusty but resilient.” The stock now lounges at ₹269, a far cry from its 52-week high of ₹554 — almost like an iron ore chunk rolling downhill. With amarket cap of ₹307 crore, aP/E of 19.2, andROE at 15.3%, it’s small but sturdy — like a steel rod you don’t notice until it dents your balance sheet.
Quarterly sales slumped to₹58.7 crore(down 22.4% YoY), andPAT tumbled 50.7% to ₹3.2 crore, yet the management smiled through it, possibly thanks to the recent₹7.46 crore arbitration award against Everllence India— sweet legal ironies are better than sweet iron billets. Debt stands at a modest₹12.8 crore, with adebt-to-equity ratio of 0.08, practically debt-free for a secondary steel producer.
Dividend yield is a cute0.78%, enough to buy a vada pav or two, but not a TMT bar. Despite weak sales, theROCE remains at 17.4%, which is like saying the engine still revs, even if the tyres are bald.
So here’s the hook: declining revenue, halved profit, but an arbitration windfall, expanded power capacity, and a UAE venture on the horizon. Suraj Products is either forging the future or getting smelted by market pressure. Ready to dive in?
2.Introduction
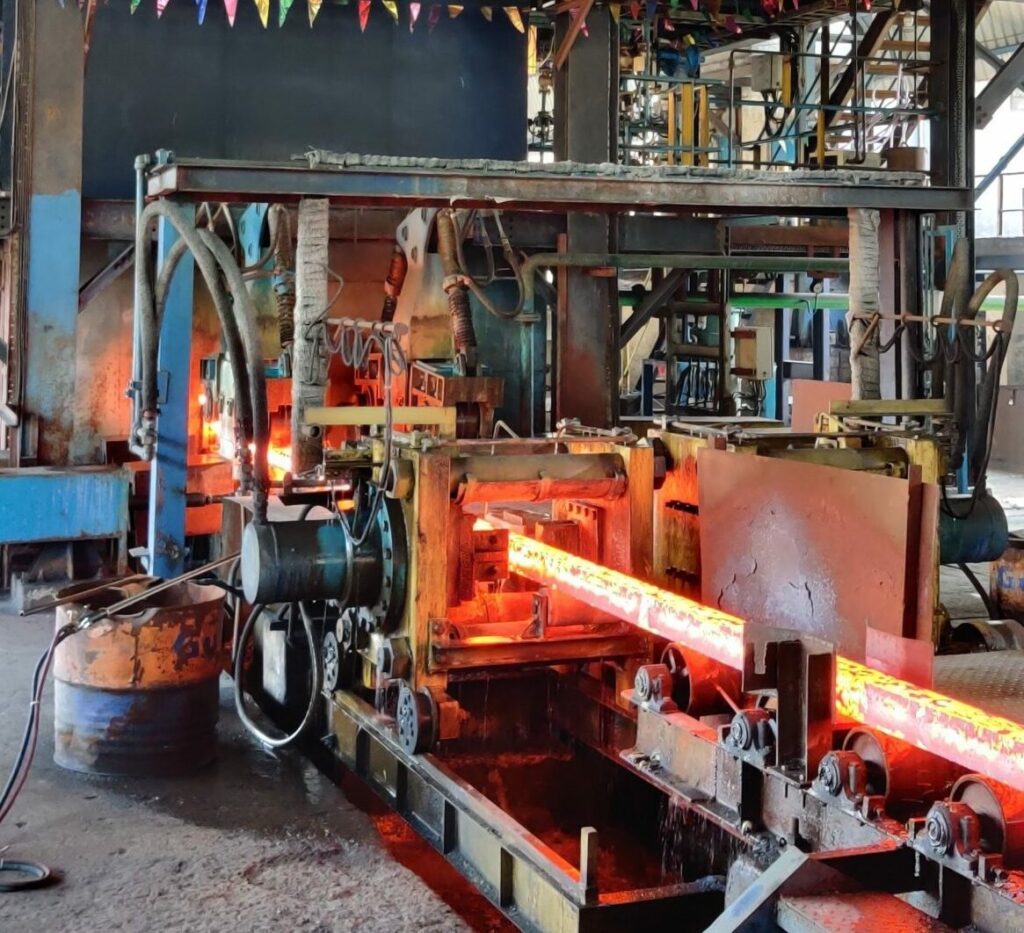
Suraj Products Ltd (SPL) is the kind of company you’d describe as “a small-town overachiever with iron lungs.” Born in 1991 and headquartered in Odisha, it quietly transformsiron ore into sponge iron, pig iron, billets, and TMT bars, and even throws in a9 MW captive power plantfor good measure.
Now, while other steel players like JSW and Tata chase global green steel headlines, Suraj Products is doing what small-town legends do best — grinding quietly, supplying semi-urban India with the bars that literally hold up half the country’s construction.
In FY25, it made around₹297 crore in sales, and₹16 crore in PAT, down from ₹29 crore the previous year. But before you dismiss it as a “melting business,” remember this — it’s almost debt-free, operates at adouble-digit OPM (9.7%), and just bagged a ₹7.46 crore arbitration victory. That’s equivalent to nearly 50% of one quarter’s profit magically arriving by courier.
Also, in a rare steel story twist, they’ve gone global — acquiring land in Abu Dhabi through their subsidiary to start a green iron project. Odisha to UAE — this company is literally exporting ambition.
So, what happens when a small iron player starts dreaming big? Let’s put this in the furnace.
3.Business Model – WTF Do They Even Do?
At its core, Suraj Products is avertically integrated mini steelmaker. From miningiron oreto producingsponge iron,pig iron,billets, andTMT bars, it owns almost every part of its value chain.
Here’s how the process flows:
- Iron Ore → Sponge Iron(36,000 MTPA capacity)
- Sponge Iron + Pig Iron → Billets(72,000 MTPA)
- Billets → TMT Bars(72,000 MTPA)
And because electricity bills can knock the life out of any steel margin, SPL smartly powers its furnaces using itsown 9 MW captive power plant— split into 3 MW each fromwaste heat recovery,fluidized bed combustion, andgas from the blast furnace.
In FY23, the production looked like this:
- Sponge Iron: 32,688 MT
- Pig Iron: 33,682 MT
- Billets: 35,100 MT
- TMT Bars: 29,180 MT
Theirrevenue mixtells the real story — TMT bars (49%) and pig iron (37%) do the heavy lifting, while sponge iron contributes only 6%. Essentially, they make their own inputs, melt them, roll them, and sell them — it’s the steel version of farm-to-table dining.
But here’s the catch: secondary steel players like Suraj Products are at the mercy of iron ore and coal prices. So when input costs rise, OPMs melt faster than a dosa on an overheated tawa.
Still, SPL’s integration, power plant, and local market focus have made it surprisingly durable. The company may not roar like JSW Steel, but it hums along like a diesel generator that just refuses to die.
4.Financials Overview
Quarterly Results – (Standalone ₹ Crores)
| Metric | Q2 FY26 | Q2 FY25 | Q1 FY26 | YoY % | QoQ % |
|---|---|---|---|---|---|
| Revenue | 58.69 | 75.68 | 80.70 | -22.4% | -27.3% |
| EBITDA | 5.86 | 10.55 | 7.28 | -44.5% | -19.5% |
| PAT | 3.20 | 6.49 | 4.59 | -50.7% | -30.3% |
| EPS (₹) | 2.81 | 5.69 | 4.03 | -50.6% | -30.2% |
Witty Take:Looks like Q2 FY26 was the quarter where the furnace took a nap. Revenue dipped 22%, profits halved, and the operating margin shrank to a skinny9.98%, barely holding the steel together. But with atax rate dropping to 21.6%, the company at least got some post-tax relief.
Still, for a business that runs on heat, this quarter was more lukewarm chai than molten metal.
5.Valuation Discussion – Fair Value Range Only
Let’s break this down using three lenses — P/E, EV/EBITDA, and a simplified DCF.
- P/E Method:
- EPS (TTM): ₹14.1
- Industry PE: 21.4
- Company PE: 19.2→Fair Range:₹14.1 × (18–22) = ₹254 – ₹310
- EV/EBITDA Method:
- EV/EBITDA: 10.3
- EBITDA (TTM): ₹29 Cr
- Enterprise Value: ₹305 Cr
- Fair Range (8x–12x): ₹240 – ₹360 per share
- DCF (back-of-the-envelope):Assuming ₹16 Cr annual profit growing at 5% for 5 years and discounting at 12%, we get intrinsic value near₹275–₹315.
Fair Value Range (Educational Only): ₹250 – ₹320 per share.Disclaimer: This fair value range is for educational purposes only and not investment advice.
6.What’s Cooking – News, Triggers, Drama
The most entertaining update?Suraj Products justwon an arbitration award of ₹7.46 croreagainst Everllence India, with 30 days to pay up. For a company making ₹3 crore a quarter, that’s basically a full extra quarter of profit falling from the legal sky.
Earlier in 2025, they alsoresumed operations at their Micro Blast Furnace, boosting efficiency and cutting raw material losses. And if that wasn’t enough, they’veacquired land in Abu Dhabi(60,910 sqm, 50-year lease) for a green steel project — clearly planning to turn desert sand into iron bars.
Oh, and remember theIncome Tax raid in Jan 2024? That saga seems to have cooled off, as FY25 results sailed through without drama.
So yes, between arbitration victories, UAE expansion, and furnace restarts — this company has been busier than a foundry on Diwali night.
7.Balance Sheet
| Particulars (₹ Cr) | Mar 2023 | Mar 2024 | Sep 2025 |
|---|---|---|---|
| Total Assets | 172 | 186 | 183 |
| Net Worth | 103 | 130 | 155 |
| Borrowings | 54 | 21 | 13 |
| Other Liabilities | 15 | 14 | 16 |
| Total Liabilities | 172 | 186 | 183 |
Commentary:
- Thedebt meltingfrom ₹54 Cr to ₹13 Cr is pure