1. At a Glance
Super Sales India is an old-school, multi-business, low-fanfare stock that once traded at nearly ₹2,000 but is now struggling to keep the engine running. Q1 FY26 profit barely blinked at ₹1.76 Cr. But here’s the plot twist: it’s trading at 0.52x Book Value. Value trap or undervalued beast in hibernation?
2. Introduction with Hook
Imagine owning a Bentley that looks mint but has the engine of a 2005 Maruti 800. That’s Super Sales India for you — an engineering + textile hybrid trying to sprint in the age of Teslas.
- Stock has corrected over 50% from highs
- Book value per share: ₹1,839, current price: ₹955
- FY25 PAT: Negative ₹2 Cr, TTM PAT still red
We investigate: Is this just a bad quarter or the beginning of the end?
3. Business Model (WTF Do They Even Do?)
Super Sales India Ltd operates in three segments:
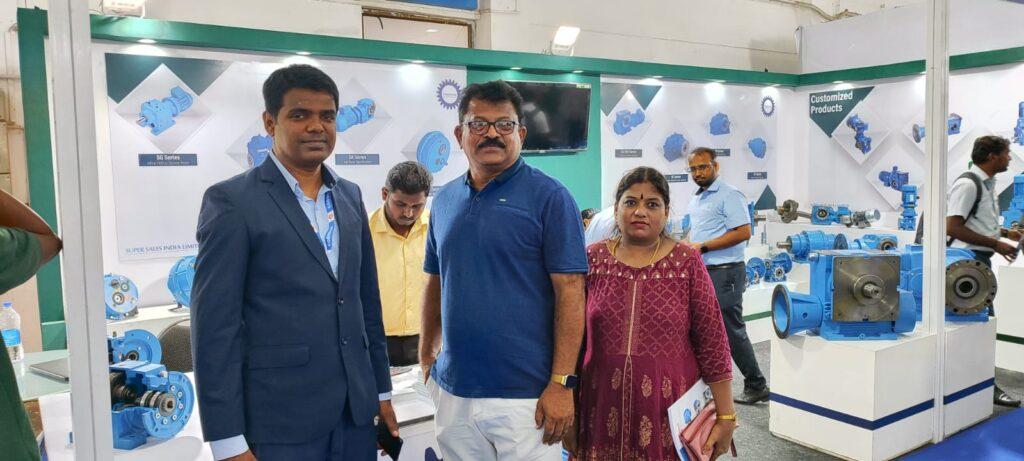
- Engineering Division: Manufacturing gears, precision parts — OEM supplier role
- Textile Division: Yarn manufacturing — volume + commodity play
- Agency Services: Acting as agents for Lakshmi Machine Works — mid-margin support business
Fun Fact: It’s one of the rare companies with an almost textbook diversification… and yet, profitability vanishes like your internet during a Zoom call.
4. Financials Overview
| FY | Sales (₹ Cr) | OPM % | PAT (₹ Cr) | ROCE % | ROE % |
|---|---|---|---|---|---|
| FY23 | 368 | 13% | 28 | 7% | 5% |
| FY24 | 419 | 10% | 20 | 5% | 3% |
| FY25 | 404 | 6% | -2 | 1% | -0.4% |
| Q1 FY26 | 98.83 | 8.4% | 1.76 | — | — |
Highlights:
- FY25 was a dud. OPMs and PAT both shrunk like wool in hot water.
- Q1 FY26 is better than Q4 FY25 (loss), but miles away from FY22 glory.
5. Valuation
- CMP: ₹955
- Book Value: ₹1,839
- P/B: 0.52x
- EV/EBITDA (approx): 12x (excl. Other Income)
Fair Value Range (Sum of the Parts):
- Engineering Business (Avg 6x EV/EBIT): ₹300–350 Cr
- Textile Business (Low margin, cyclical): ₹100–120 Cr
- Agency biz (steady): ₹40–50 Cr
- Net Cash & Investments: ₹360 Cr
Total SOTP Valuation: ₹800–880 Cr → FV Range per share: ₹2,650–₹2,900
BUT discounting for low ROCE, market gives 0.5x BV.
EduFair Value Range (Discounted): ₹1,200 – ₹1,500
6. What’s Cooking – News, Triggers, Drama
- Q1 FY26 profit bounce back (₹1.76 Cr) after 2 quarters of losses
- AGM Outcome: Dividend declared, re-appointment of directors — nothing dramatic
- High other income due to investments — core biz still sleepy
- No debt crisis, but low utilization of assets
Upcoming Triggers:
- Capex/expansion announcement in textiles
- Rebound in gear exports
- Possible stake increase by promoters?
7. Balance Sheet
| Item | FY25 (₹ Cr) |
|---|---|
| Equity Capital | 3 |
| Reserves | 562 |
| Borrowings | 86 |
| Other Liabilities | 83 |
| Fixed Assets | 164 |
| Investments | 367 |
| Other Assets (incl. Cash) | 203 |
| Total Assets | 734 |
Key Points:
- Conservative leverage; Debt:Equity < 0.15x
- Heavy investment book — over ₹350 Cr in investments, fueling “other income”
- Core business not sweating assets enough
8. Cash Flow – Sab Number Game Hai
| Year | CFO | CFI | CFF | Net Cash Flow |
|---|---|---|---|---|
| FY23 | 65 | -48 | -5 | 11 |
| FY24 | 34 | -37 | -7 | -11 |
| FY25 | 29 | -26 | -4 | -2 |
Observations:
- Decent operating cash flows, even when profits were negative
- Continues to invest in assets and financial instruments
- Not dependent on debt or equity dilution (thankfully)
9. Ratios – Sexy or Stressy?
| Metric | FY25 | Comment |
|---|---|---|
| ROCE | 1% | Borderline insult |
| ROE | -0.38% | Investors crying |
| Debtor Days | 66 | Okay-ish |
| Inventory Days | 99 | Efficient for textile biz |
| OPM | 6% | Needs CPR |
Nothing “sexy” here, unless you count slow deaths as a kink.
10. P&L Breakdown – Show Me the Money
| Year | Sales | Expenses | EBIT | PBT | PAT |
|---|---|---|---|---|---|
| FY24 | 419 | 377 | 43 | 26 | 20 |
| FY25 | 404 | 380 | 24 | -2 | -2 |
| Q1 FY26 | 98.83 | 90.5 | 8.33 | 2.25 | 1.76 |
Takeaway:
- Q1 is a relief rally, but not a comeback.
- Margins remain pressured, other income still keeping the P&L afloat.
11. Peer Comparison
| Company | CMP ₹ | P/E | ROCE % | ROE % | P/BV | PAT (TTM) Cr |
|---|---|---|---|---|---|---|
| KPR Mill | 1,189 | 51 | 19.8 | 17.0 | 8.13 | 797 |
| Trident | 31.6 | 43 | 9.5 | 8.3 | 3.48 | 370 |
| Vardhman Textiles | 499.6 | 16.4 | 11.2 | 9.3 | 1.46 | 883 |
| Welspun Living | 142.4 | 21.6 | 14.4 | 13.7 | 2.87 | 639 |
| Super Sales India | 954.7 | — | 1.1 | -0.4 | 0.52 | -1 |
Verdict: All others are dancing at the textile prom, Super Sales is cleaning the floor after it ends.
12. Miscellaneous – Shareholding, Promoters
| Stakeholder | % Holding |
|---|---|
| Promoters | 59.43% |
| Public | 40.56% |
| No. of Shareholders | 5,525 |
Noteworthy:
- No recent promoter buying — suspicious for a “deep value” stock
- Consistent holding suggests no internal panic
- Number of shareholders is rising — retail seems to be bottom-fishing
13. EduInvesting Verdict™
Super Sales India is the kind of company that makes you go “hmm…”
The numbers scream deep value, but the operations whisper “meh”.
You’re staring at a business:
- That’s undervalued on paper (P/B < 0.6)
- But operationally sluggish (ROCE 1%, ROE -0.4%)
- Where other income is a hero, and core business a sidekick
- Whose peer group is leagues ahead in growth & margins
So here’s our EduInvesting Take:
Super Sales is a balance-sheet play, not a business momentum play.
If and only if management decides to push the pedal on performance, this could be a high-reward turnaround story. Until then — it’s textbook cheap for a reason.
Metadata
– Written by EduInvesting Team | 21 July 2025
– Tags: Super Sales India, Textile Stocks, Deep Value, Q1FY26, Balance Sheet Investing


