Sterling & Wilson Renewable Energy Ltd Q3 FY26 – ₹2,092 Cr Quarterly Revenue, ₹9,096 Cr Order Book, 25.3 GW Pipeline & One Impairment That Gave Auditors Nightmares
1. At a Glance – Blink and You’ll Miss the Drama
Sterling & Wilson Renewable Energy Ltd is currently trading around ₹198, sitting on a market cap of roughly ₹4,626 crore, and behaving like that topper kid who failed one subject but still insists IIT is coming. Q3 FY26 delivered quarterly revenue of ₹2,092 crore, up 13.9% YoY, and quarterly PAT of ₹1.55 crore, up nearly 48% YoY, which sounds impressive until you notice the EPS doing somersaults like a budget airline stock. The stock is down ~12.5% over three months and ~38% over six months, which tells you the market mood is less “solar revolution” and more “bhai, explain impairment first.” ROCE stands at 17%, debt is ₹1,226 crore, promoter holding is 45.7% with 27.6% pledge, and yes, Reliance is watching from the promoter gallery like a strict cricket coach. This is a company where numbers are improving, confidence is returning, but trust is still on probation. Curious already? Good. Let’s go deeper.
2. Introduction – From EPC Rockstar to Financial Therapy Patient
Sterling & Wilson Renewable Energy Ltd has lived multiple corporate lives in one decade. Once the global solar EPC darling under the Shapoorji Pallonji Group, then the poster child of international expansion gone wrong, and now the comeback candidate backed by Reliance Industries through Reliance New Energy Limited. If corporate biographies were Netflix series, this one would be titled “Too Global, Too Soon.”
The company designs, engineers, procures, constructs, commissions, and maintains solar projects across the globe. Sounds simple? It’s not. EPC is a brutal business where margins are thinner than a politician’s apology. Sterling & Wilson went aggressive internationally, margins collapsed, projects bled, and shareholders cried. Then came Reliance in 2022, took a 40% stake, and said, “Enough globe-trotting. Go desi, get profitable, and behave.”
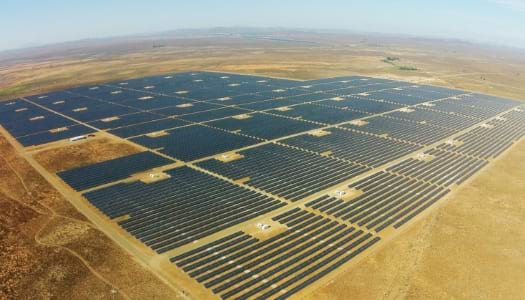
Fast forward to FY25–FY26: domestic EPC now forms 80% of EPC revenue, international is trimmed to 16%, margins are stabilising, order book is ₹9,096 crore, and the bid pipeline is a monstrous 25.3 GW. But then—bam—Q3 FY26 drops a ₹2,638 crore impairment charge like a thunderbolt, reminding everyone that past sins don’t vanish just because EBITDA looks better.
So the big question: is this a genuine turnaround or just a better-dressed balance sheet with old ghosts hiding in reserves?
3. Business Model – WTF Do They Even Do?
Imagine you want to build a solar plant. You don’t want to talk to 47 vendors, fight with customs, manage labour, or pray for grid connectivity. You call Sterling & Wilson. That’s the pitch.
Their business has two main legs:
EPC (96% of FY25 revenue): This is the main engine. Utility-scale solar, rooftop solar, floating solar, hybrid projects, and now even wind + solar + storage. It’s asset-light, meaning they don’t own the plant; they build it, hand it over, and move on. Domestic EPC has grown massively—80% of EPC revenue in FY25 versus just 25% in FY23. International EPC, once 66%, is now a disciplined 16%. Translation: fewer passport stamps, more predictable margins.
O&M (4% of FY25 revenue): Operations and Maintenance is boring but beautiful. Long-term contracts, steady cash flows, and lower stress. O&M portfolio stands at 8.7 GWp in FY25, up from 7 GWp in FY23. Not flashy, but reliable—like FD interest in a world of meme stocks.
They’ve also entered Battery Energy Storage Systems (BESS) and wind EPC, securing their first hybrid 127 MW AC project and a BESS contract from JSW. Basically, Sterling & Wilson is trying to become the Swiss Army knife of renewable EPC.
Still, EPC margins are single-digit. If you’re expecting FMCG-style profitability, please adjust expectations or switch tabs.
4. Financials Overview – Numbers That Argue With Each Other

One Response
lovely analysis. straight in the face.