Sreeleathers Ltd FY2026: A Shoe Box Full of Cash, Returns? Not So Much
Spotted a factual error — a wrong number, date, or fact? Tell us and we will check the source.
General information and entertainment, not investment advice. The author is not a SEBI-registered adviser or research analyst. No recommendation, no promised returns. Markets carry risk including loss of capital. Figures may not be current. Consult a registered adviser before acting.
1. At a Glance
Sreeleathers printed ₹248 Cr in sales and ₹28.7 Cr in profit for FY26—a 15% sales bump and 27% profit sprint year-on-year. The quarter-ending March 2026 landed ₹62.7 Cr sales and ₹9.67 Cr net profit.
Yet the engine isn’t singing. Returns on equity sank to 5.77% (versus 6% a year ago), and return on capital employed sits at 5.73%—both languishing below borrowing costs in most market scenarios.
The stock trades at ₹202.65, giving it a 16.4x P/E against a peer band of 30–68x. It holds ₹366 Cr in net cash—enough to hand back 80% of its market cap.
A small, profitable business with a war chest of cash. But is the cash pit a moat or a holding pattern?
2. Introduction
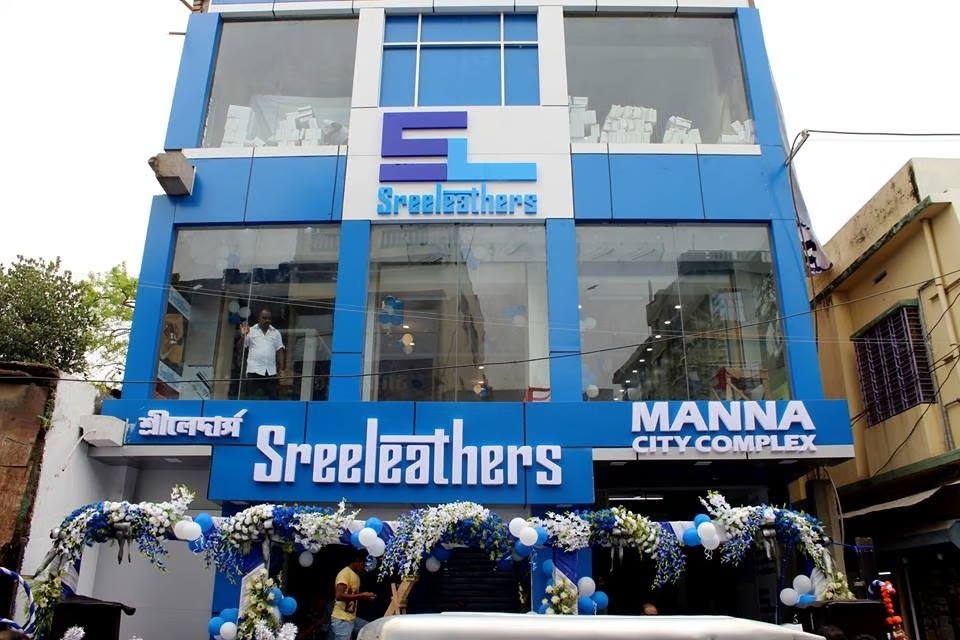
Sreeleathers Ltd, listed on BSE (535601) and NSE (SREEL), is a 35-year-old leather and non-leather footwear trader. The company runs 27 dealer showrooms alongside its flagship Lindsay Street store in Kolkata—which Screener marks as the world’s largest single-brand footwear retail space (take that with the skepticism it deserves).
The March 2026 board meeting approved a ₹1 dividend (on a face value of ₹10), the first payout in years, and appointed a new independent director with 30 years of retail experience. Translation: governance is awake.
The business runs three units—two in Kolkata, one in Jaipur. Non-retail (wholesale/dealer) channel churns 82% of revenue; retail (flagship + other stores) 18%.
3. Business Model: WTF Do They Even Do?
Sreeleathers buys leather and synthetic footwear, shoes, sandals, chappals, accessories—then stocks them in brick-and-mortar.
The menu: men’s formal and casual shoes, sandals, slippers, chappals; women’s heels, jutti, bags; kids’ school shoes; belts, wallets, trolleys. Recently, washable footwear made the roster.
Cost structure is cruel. Raw material eats 76% of sales (₹189.7 Cr out of ₹248 Cr in FY26). That leaves ₹58 Cr to cover employee costs (₹8.5 Cr), selling and admin (₹?—buried in the filings), rent, depreciation, interest. By the time the company reaches net profit (₹28.7 Cr), margins hover at 11.6%.
The wholesale model lets the company stock dealers rather than retail staff—lower capex, higher scale. But it also means less control over brand and pricing, and fat inventory days. March 2026 saw inventory at 15 days (down from 20 in March 2025)—so supply chains are tightening, a small win.
Competition is loud: Bata, Metro Brands, Relaxo Footwear all have scale and brand heft. Sreeleathers’ moat is location (Kolkata-first), nostalgia, and a dealer network that moves volume. Hardly fortress-grade.
4. Financials Overview
Figures are consolidated, in ₹ crore.
Metric
FY26
FY25
FY24
Revenue
248.4
216.9
215.2
EBITDA
39.9
32.4
37.8
Net Profit
28.7
22.6
26.8
EPS (₹)
12.41
9.75
11.57
Revenue rose 14.5% year-on-year in FY26, marking a recovery from the 0.3% crawl of FY25. Profit jumped 27.4%—profit volatility always masks operational reality here.
EBITDA margin compressed to 16.1% (FY26) from 15% (FY25), a modest expansion. Net margin stayed flat at 11.6%, underlining the raw-material squeeze.
Latest Quarter (Q4 FY26):
The March quarter delivered ₹62.7 Cr sales, ₹9.94 Cr operating profit, and ₹9.67 Cr net profit. YoY sales growth hit 17.95%; profit growth, 82.8% (off a low base of ₹5.29 Cr in Q4 FY25). The quarter’s operating margin: 15.86%.
Q4 is seasonally strong (summer footwear sales), so don’t extrapolate the quarter to an annual run rate.
5. Market Expectations & Historical Multiples
This section describes how the market is currently pricing the company and how that compares with its own history and peer group. It is descriptive, not predictive.
Metric
Current
Historical Avg (10Y)
Peer Median
P/E
16.4x
18.6x
42.3x
EV/EBITDA
11.3x
12.8x
13.6x
P/B
0.92x
1.14x
1.12x
ROE
5.77%
6.9%
14.2%
ROCE
5.73%
8.1%
15.7%
The market trades Sreeleathers at a 16.4x P/E multiple, sitting below its own 10-year average of 18.6x and well south of the peer median of 42.3x. The gap signals the market is pricing in structural headwinds: low returns on capital, modest scale, and raw-material margin compression.