At a Glance
SJS Enterprises (the cool kid in automotive bling) just flexed its Q1 FY26 numbers: Revenue ₹210 Cr (+11% YoY), PAT ₹35 Cr (+24%), and OPM holding a sexy 27%. While auto ancillaries struggle with margin squeeze, SJS is casually sipping its profit cocktail – debt-free, high ROCE (23%), and an order book that keeps OEMs smiling.
1. Introduction
Think of SJS as the “fashion designer” for vehicles and appliances – while others make the engine roar, SJS makes sure it looks Instagram-ready. From decals to chrome-plated parts, it is everywhere your eyes land on a bike or a car. FY26 has kicked off strong with double-digit profit growth, proving aesthetics pays.
2. Business Model (WTF Do They Even Do?)
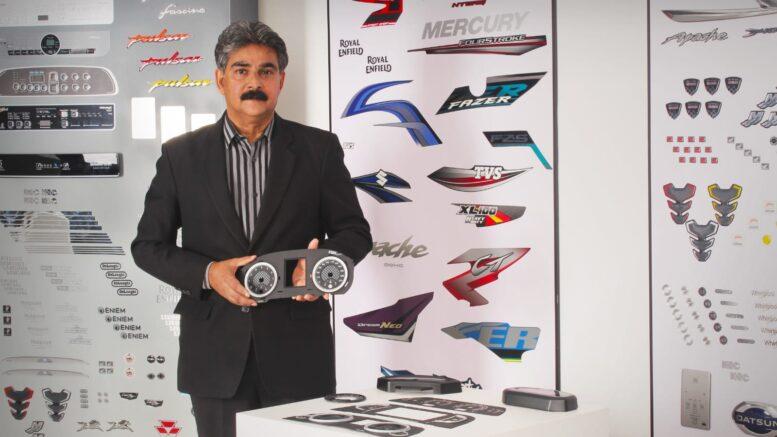
- Core: Design-to-delivery aesthetics solutions for OEMs (auto + consumer durables).
- Products: Decals, 2D/3D appliques, badges, domes, chrome parts, overlays, lens masks, IML/IMD.
- Aftermarket: “Transform” accessories for two-wheelers & PVs.
- Clients: Top auto OEMs, Hero MotoCorp, etc.
- Edge: High entry barriers with design IP + sticky OEM relations.
3. Financials Overview
Q1 FY26 Performance
- Revenue: ₹210 Cr (+11%)
- EBITDA: ₹56 Cr (OPM 27%)
- PAT: ₹35 Cr (EPS ₹11.03)
- Net Debt: Almost zero.
FY25 Recap
- Revenue: ₹760 Cr
- PAT: ₹119 Cr
- OPM: 26%
The company runs a margin fortress compared to peers.
4. Valuation
- P/E: 31x – not cheap, but justified by growth & margins.
- P/B: 5.7x – investors paying for premium quality.
- EV/EBITDA: ~17x – priced for perfection.
Fair Value Range: ₹1,100 – ₹1,300 (close to current market price, stable outlook).
5. What’s Cooking – News, Triggers, Drama
- Capacity Expansion: Ongoing to meet growing demand.
- Acquisitions: Walter Pack (90% stake) strengthens high-tech decorative parts portfolio.
- Green Move: Signed solar PPA to reduce energy costs.
- Promoter Stake Drop: Now at 21.6% – market doesn’t like it, but FIIs love it.
- Hero MotoCorp Orders: New supplies to boost volumes.
6. Balance Sheet
| (₹ Cr) | FY23 | FY24 | FY25 |
|---|---|---|---|
| Assets | 537 | 785 | 868 |
| Liabilities | 108 | 235 | 190 |
| Net Worth | 429 | 551 | 677 |
| Borrowings | 30 | 84 | 37 |
Comment: Low debt, high reserves – a CFO’s dream.
7. Cash Flow – Sab Number Game Hai
| (₹ Cr) | FY23 | FY24 | FY25 |
|---|---|---|---|
| Operating | 87 | 109 | 163 |
| Investing | -100 | -133 | -98 |
| Financing | +5 | +29 | -60 |
Observation: Strong cash generation funds capex easily.
8. Ratios – Sexy or Stressy?
| Ratio | FY23 | FY24 | FY25 |
|---|---|---|---|
| ROE | 18% | 19% | 19% |
| ROCE | 21% | 22% | 23% |
| PAT Margin | 15% | 16% | 16% |
| D/E | 0.1 | 0.15 | 0.05 |
Verdict: Sexy. No stressy.
9. P&L Breakdown – Show Me the Money
| (₹ Cr) | FY23 | FY24 | FY25 |
|---|---|---|---|
| Revenue | 433 | 628 | 760 |
| EBITDA | 107 | 153 | 196 |
| PAT | 67 | 85 | 119 |
Comment: Revenue growth + margin consistency = winning formula.
10. Peer Comparison
| Company | Revenue (₹ Cr) | PAT (₹ Cr) | P/E |
|---|---|---|---|
| Uno Minda | 16,775 | 934 | 66 |
| Endurance Tech | 11,561 | 782 | 47 |
| Bharat Forge | 15,123 | 923 | 63 |
| SJS | 760 | 119 | 31 |
Verdict: Smaller, but more profitable on margins.
11. Miscellaneous – Shareholding, Promoters
- Promoter Holding: 21.6% (low, down from 50% three years ago)
- FIIs: 16.9% (growing steadily)
- DIIs: 28.3%
- Public: 33.1%
12. EduInvesting Verdict™
SJS Enterprises is not just another auto ancillary – it’s a design monopoly with high entry barriers. The company’s growth trajectory is clear: expand capacity, deepen OEM ties, and ride premiumisation trends. Concerns? Low promoter stake could mean less skin in the game. However, FIIs & DIIs seem convinced.
SWOT Analysis
- Strengths: Sticky OEM relations, high OPM, low debt.
- Weaknesses: Low promoter holding.
- Opportunities: Export growth, aftermarket expansion.
- Threats: Auto slowdown, input cost spikes.
This stock is like the chrome badge on a luxury car – small, shiny, but adds a lot of value.
Written by EduInvesting Team | 29 July 2025
SEO Tags: SJS Enterprises, Auto Components, Q1 FY26 Result