Sirca Paints India Ltd Q1FY26 – ₹114 Cr Quarterly Sales, 39% PAT Growth, P/E 50x: Italian Autograph or Desi Whitewash?
Date of Publishing -
Spotted a factual error — a wrong number, date, or fact? Tell us and we will check the source.
1. At a Glance
Sirca Paints is trying to convince India that painting your wall in Italian luxury shades is worth a small fortune. Market cap: ₹2,633 Cr. CMP: ₹480. One-year return: +40%. Quarterly sales: ₹114 Cr (+45% YoY). PAT: ₹14 Cr (+39% YoY). EPS: ₹9.68. P/E: a spicy 49.6x. Book value is only ₹63.8, so price/book is a nosebleed 7.5x. Debt? Just ₹8 Cr — basically pocket change. ROE is a stylish 14.9%, ROCE 19.7%. Looks like the Gucci of paint stocks: sleek, expensive, and you’re not sure if it’s worth it.
2. Introduction
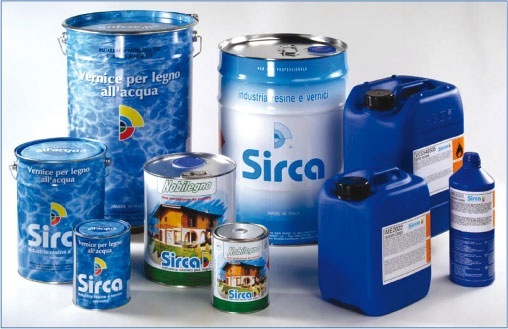
The paints industry is a Bollywood blockbuster — Asian Paints plays the superstar, Berger the dependable second lead, Nerolac the aging uncle, and Sirca the flashy cameo. Sirca is all about wood coatings and luxury Italian finishes. Their brand promise? “Your Italian Autograph.” Translation: buy our paints, feel like Michelangelo signed your wall.
The company is growing at a healthy clip, expanding distribution (4,000+ dealers), and just bought the Wembley Paints brand — a 1961 legacy name. But while Asian Paints fights over metros, Sirca is feasting in Delhi and North India, pulling 70% of revenue from that geography. Dependence much?
3. Business Model – WTF Do They Even Do?
Sirca (Luxury Coatings): The crown jewel. Premium Italian wood and wall paints. Exclusive rights in India, Nepal, Sri Lanka, Bangladesh. Basically, Ferrari on your furniture.
Unico: Mass-market wood coatings. Think Maruti Swift after Ferrari.
Oikos: Decorative textured finishes, high-end walls. Great for Instagram reels.
Welcome: Thinners and reducers. Every “luxury” brand needs a jhola of jugaad.