Silgo Retail Ltd Q3 FY26: ₹11 Cr Quarterly Sales, 27% PAT Jump, But Promoter Pledge Bomb Drops at 15.63%
1. At a Glance – Silver Shine or Foil Paper?
Silgo Retail Ltd is currently sitting at ₹73 with a market cap of ₹179 Cr. In the last 3 months, the stock is up 20.2%, and over 1 year it has delivered a spicy 78.6% return. Not bad for a company that sells silver rings and jhumkas out of Jaipur.
Latest Q3 FY26 (Dec 2025) numbers?
Quarterly Sales: ₹11.04 Cr
Quarterly PAT: ₹1.29 Cr
Q-o-Q Sales Growth: 8.77%
Q-o-Q PAT Growth: 27.72%
Stock P/E: 32.2
ROCE: 10.5%
ROE: 7.96%
Debt: ₹0 Cr (Yes, zero on books)
Sounds shiny, right?
But wait.
Promoter holding has fallen to 40.44% (Feb 2026). On 19 February 2026, promoter Nitin Jain pledged 50,00,000 shares (15.63%) to Ashika Credit Ltd. Meanwhile, the company is seeking approvals for borrowings up to ₹200 Cr and guarantees up to ₹500 Cr.
So what is this? A clean, debt-free silver jewellery brand scaling up… or a smallcap preparing for financial gymnastics?
Let’s open the jewellery box carefully.
2. Introduction – Jaipur Se Wall Street?
Silgo Retail Ltd was incorporated in 2016. The business? Designing, manufacturing, retailing and wholesaling silver jewellery.
From wedding bangles to daily-wear rings, everything is cast in 925 sterling silver and hallmarked by BIS. Since FY22, they also started dealing in gemstones. But let’s not overhype that — revenue breakup for H1FY24 clearly says:
Silver: 99%
Gemstones: 1%
So gemstones are currently that cousin who attends family weddings but doesn’t pay for anything.
The company operates from Jaipur with an installed manufacturing capacity of 7,000 kg per annum. Capacity utilisation as of Q2FY24? Only 27%.
Pause.
You have 7,000 kg capacity. You’re using just 27%. That’s like buying a 7-bedroom bungalow and living in one room.
Why?
Is demand low? Or are they building for future growth? That’s the big question.
Meanwhile, sales growth over 5 years is just 9.33%. Profit growth is better at 18% over 5 years and 51.6% in TTM.
So profits are improving faster than sales. Margin expansion game?
Or accounting glow-up?
Let’s go deeper.
3. Business Model – WTF Do They Even Do?
Silgo does three main things:
Design silver jewellery
Manufacture it (48% revenue H1FY24)
Trade it (52% revenue H1FY24)
So they are half karigar, half trader.
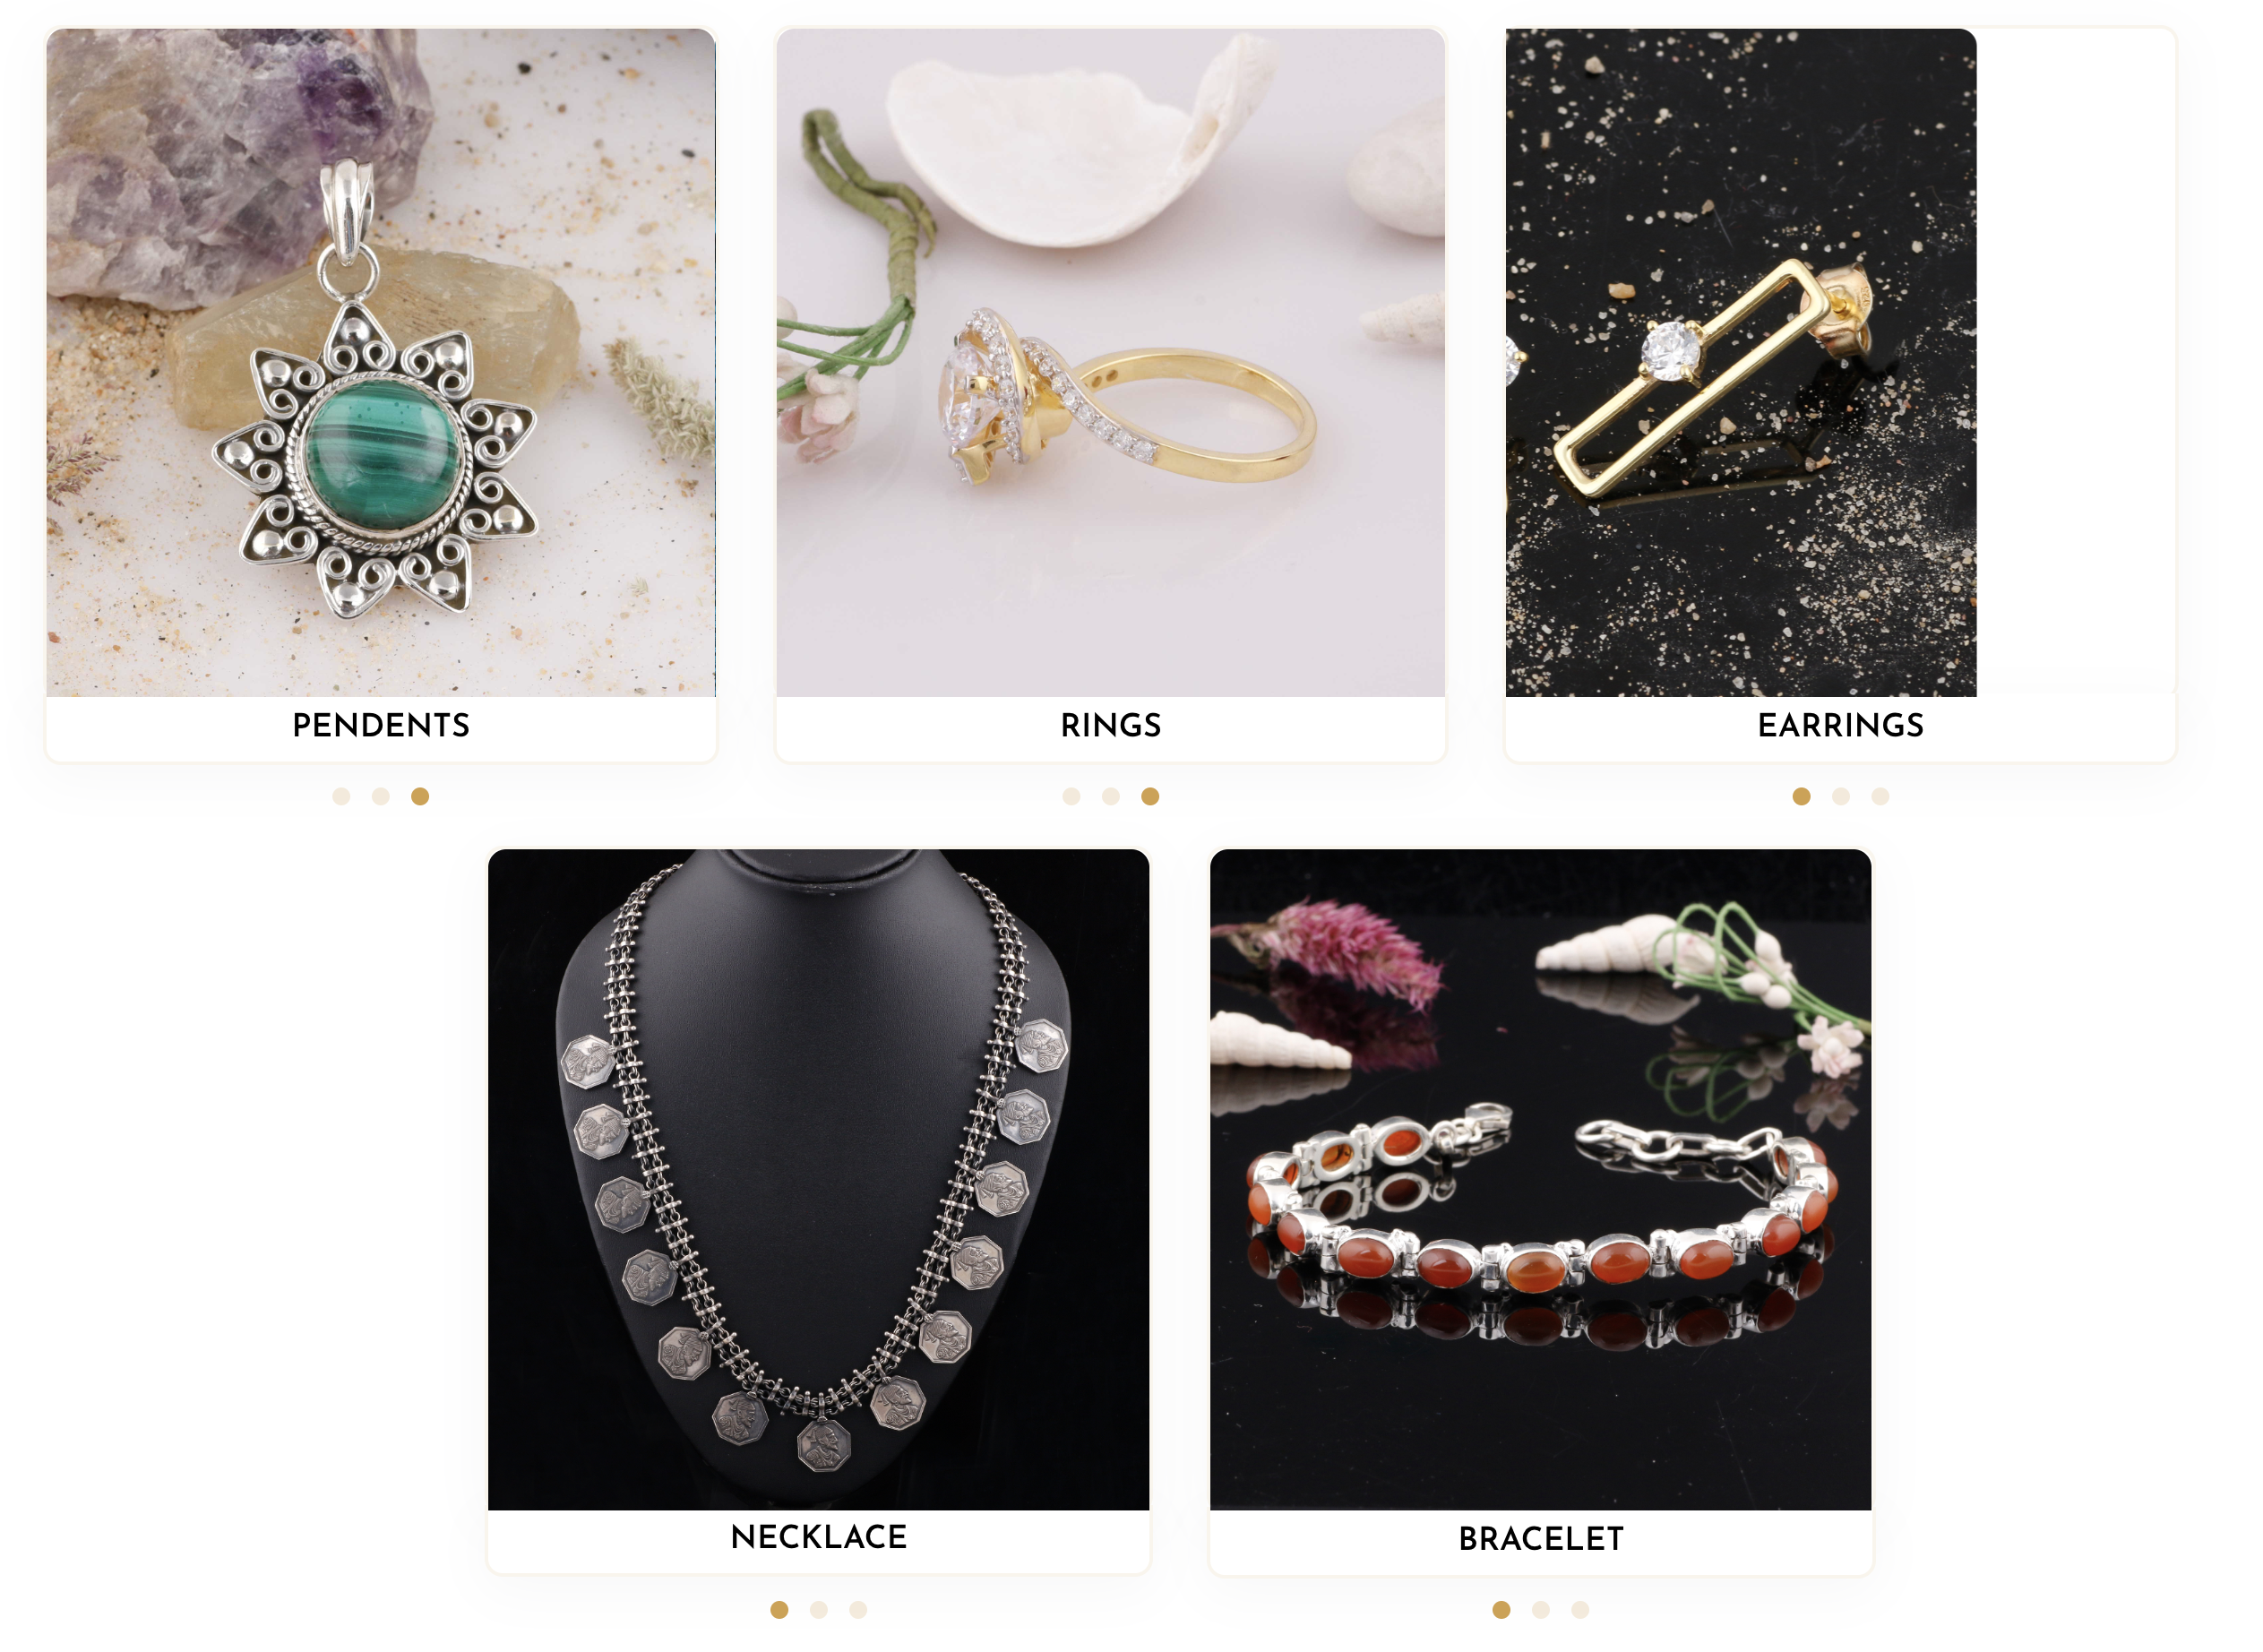
Products include:
Rings
Earrings
Bracelets
Necklaces
Jhumki
Bangles
Customised jewellery
Online products are BIS hallmarked and made in 925 sterling silver.
Client concentration?
Top 5 customers: 73% of revenue
Top 10 customers: 91% of revenue
That is not diversification. That is “bhai please don’t leave us” dependency.
Imagine if 2 customers decide to negotiate hard or switch vendors. Boom — quarterly numbers shaken.
They used to export silver jewellery. Post-COVID, exports declined and operations were scaled back. Now management says they are planning to resume and penetrate US markets.
Planning.
Not done yet. Just planning.
So currently, core revenue is domestic-focused, silver-heavy, customer-concentrated, and underutilising capacity.
Still excited? Good. Because the numbers get more interesting.
4. Financials Overview – Let’s Talk Numbers, Not Emotions