Search for Stocks /

Sical Logistics FY26: From CIRP Wreck to 74% Revenue Revival

Spotted a factual error — a wrong number, date, or fact? Tell us and we will check the source.

General information and entertainment, not investment advice. The author is not a SEBI-registered adviser or research analyst. No recommendation, no promised returns. Markets carry risk including loss of capital. Figures may not be current. Consult a registered adviser before acting.


1. At a Glance

Sical emerged from corporate insolvency in January 2023 under Pristine Group’s watch. One year later, in FY25, it generated ₹221.82 Cr revenue and ₹221 Cr in net losses since incorporation. FY26 flipped the script: revenue jumped 74% to ₹385.68 Cr, EBITDA surged 264% to ₹783 Mn, and the company returned to net profit of ₹49 Cr.

The stock sits at ₹83.49 against a historical market cap of ₹688 Cr (as of June 12, 2026). It trades at 530x earnings—a figure so extreme it signals either profound recovery unpriced or a market holding its breath.

The balance sheet still carries ₹485 Cr in debt against ₹52 Cr in net worth. The company’s return on equity is 2%, its return on capital employed is 10%, and its interest coverage is 1.02x. Promoters have pledged 56% of their stake.

A ₹934 Cr rights issue raised capital at ₹64 per share; proceeds will shore up the balance sheet for compliance and expansion in southern India’s underpenetrated rail-logistics corridor.


2. Introduction

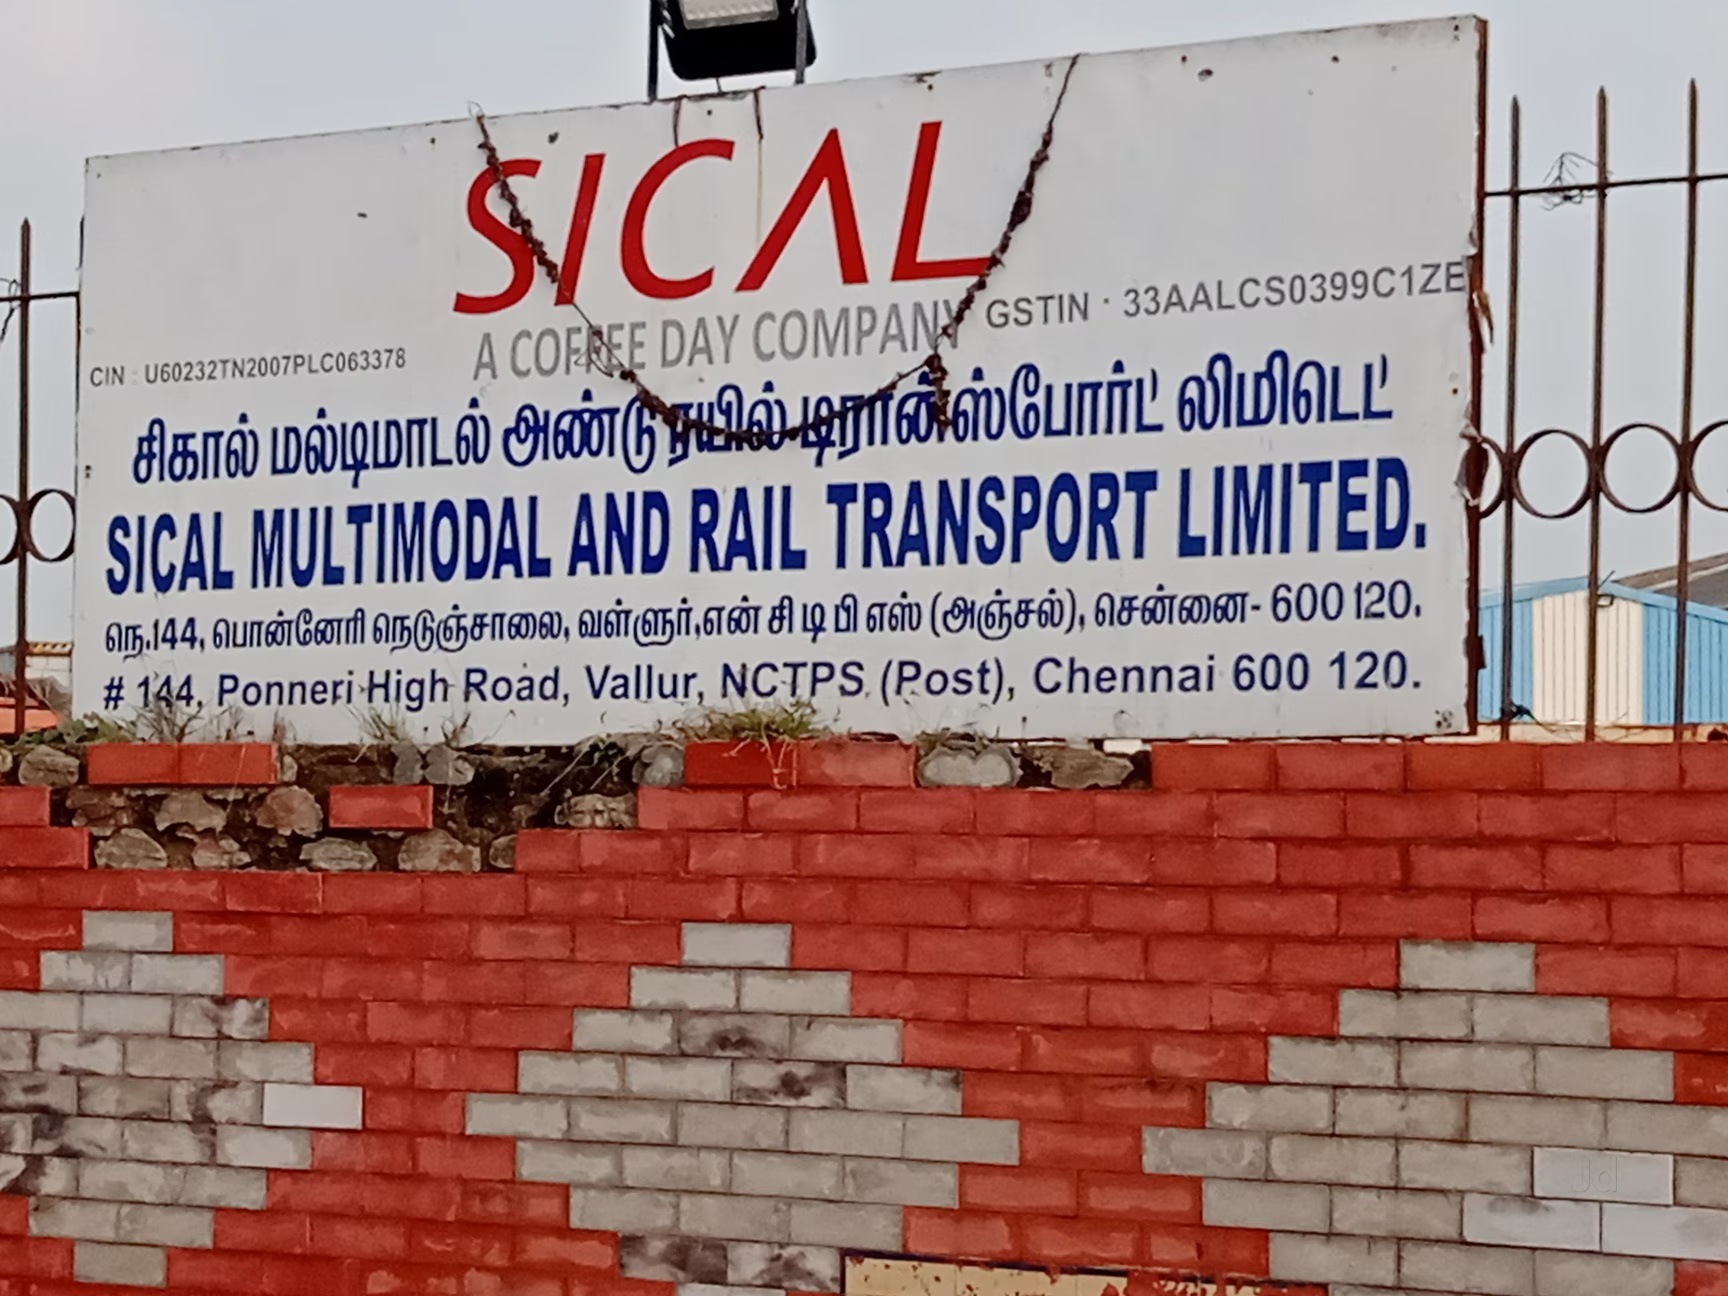
Sical is a 71-year-old logistics operator based in Chennai, founded in 1955 as South India Corporation. It spent decades as a mining-focused, capital-intensive utility—owning dredgers, crane fleets, and port infrastructure.

In 2011, Coffee Day Group took control. The company expanded into container freight stations (CFS) across Chennai, Tuticorin, and Visakhapatnam, then rail logistics, warehousing, and multi-modal parks (MMLP).

By FY19, revenue peaked at ₹1,732 Cr. Then came the reckoning: coal block reallocations, Covid disruption, Coffee Day group liquidity stress, and accumulated debt from years of capital-heavy builds. The company went into CIRP (Corporate Insolvency Resolution Process) in March 2021.

Pristine Logistics—a BlackRock-backed, Kanpur-headquartered multi-modal player operating pan-India—acquired it in January 2023. Pristine’s mandate was simple: operational revival, governance, and footprint expansion into the South.

The result: FY24 revenue ₹221 Cr (still in trough). FY25 revenue flat at ₹222 Cr but EBITDA doubled to ₹215 Mn. FY26 break: ₹386 Cr revenue, ₹783 Mn EBITDA, return to ₹49 Cr PAT.


3. Business Model: WTF Do They Even Do?

Sical operates five business verticals, none pure-commodity, all infrastructure-plus-services.

Mining Logistics (43% of FY26 revenue, ₹1,648 Mn): Removes overburden (loose rock and soil) from open-cast mines—contractual work for Coal India, SECL, and private miners. Owns excavators, dumpers, dozers, graders. Won ₹34,222 Mn in a multi-year SECL contract announced May 2026. Capital-light margins, stable long-term contracts.

Container Freight Stations—CFS (36% of revenue, ₹1,399 Mn): Off-dock terminals at Chennai (24,362 TEU/year, +31% YoY), Tuticorin (27,492 TEU/year, +10%), and Visakhapatnam (148,192 TEU/year, +14%). Core job: customs clearance, dwell time reduction, value-added services (labeling, palletization) for exporters and importers. Chennai CFS is the South’s top performer by NICDC metrics, holding 10%+ market share.

Multi-Modal Logistics Parks—MMLP (part of 36% above, ₹1,399 Mn combined): Opened first private rail-linked park in Chennai in December 2025. A rail siding + container yard + truck parking + customs facility on 82 acres, capturing cargo that sits gridlocked on road. Projected capacity: 50–70 rakes/month inbound+outbound, 100–140 container rakes.

Warehousing & 3PL (21% of revenue, ₹815 Mn): 20 facilities, 1.2 Mn sq. ft. Storage for FMCD, pharma, electricals. Recently entered national super-stockist model in pharma for margin lift.

One quirk: Sical still owns a cutter suction dredger. Deployed for port deepening and LNG terminal work, it’s occasional revenue but a reminder of the company’s old capital-heavy DNA.

The business is geographically and volumetrically concentrated. Top customer in FY23 was 66% of revenue; top 5 were 57%. Pristine’s first task post-acquisition was destressing this concentration and pivoting from Coffee Day group captive volumes to open-market contracting.


4. Financials Overview

Figures are consolidated, in ₹ crore.

Result Type: Yearly (Annual Consolidated).

MetricFY24FY25FY26YoY Growth (FY26)
Revenue221.09221.82385.68+74%
EBITDA63.7350.25170.79+264%
EBITDA Margin28.8%22.7%44.3%+21.6pp
PAT(28.29)(25.83)49.4From loss to profit
EPS (annualized FY26)(1.35)(1.24)5.69Turnaround

Quarterly Trajectory (FY26 Quarters):

PeriodRevenueOperating ProfitOPMNet Profit
Q1 FY26₹97.54 Cr₹22.93 Cr23.5%Loss
Q2 FY26₹89.81 Cr₹18.10 Cr20.2%Profit
Q3 FY26₹93.16 Cr₹17.85 Cr19.2%Profit
Q4 FY26₹105.17 Cr₹19.43 Cr18.5%Loss

Revenue grew 29.6% QoQ in Q1 FY26 vs Q4 FY25. Mining logistics spiked on new SECL contract commencement and CFS volume recovery post-port decongestion. Q4 FY26 saw a margin squeeze and loss reversion—management indicated other income timing (₹1.74 Cr vs ₹58.39 Cr in Q3) and higher interest costs (₹16.62 Cr vs ₹15.30 Cr in Q1).

Depreciation fell from ₹47.73 Cr (FY25) to ₹41.68 Cr (FY26), signaling asset write-offs completing from CIRP and lower incremental CapEx.

Concall Commentary (May 29, 2026): Management guided that FY26 represented “re-establishment & turnaround phase” with “operational revival through cargo volumes and logistics services stabilization.” Pristine brought “strong capital backing, execution scale, and operating strength.” MMLP in Bangalore under development; CFS capacity augmentation ongoing at Vizag and Tuticorin.


5. Market Expectations & Historical Multiples

This section describes how the market is currently pricing the company and how that compares with its own history and peer group. It is descriptive, not predictive.

MetricCurrent (FY26)5-Yr AveragePeer Median
P/E14.7x452x23.7x
EV/EBITDA6.5x(negative periods excluded)9.6x
ROE2%(97.9% avg over 3y)11.1%
ROCE10%(−1% avg over 3y)12.5%
P/B5.07x(excluded during CIRP)2.41x

The market currently pays 14.7x FY26 earnings here, against a peer median of 23.7x. This reflects the company’s recent turnaround credibility gap: a single year of profit after seven years of losses invites skepticism. The EV/EBITDA at 6.5x sits below peers’ 9.6x, plausible given debt overhang (₹485 Cr vs ₹52 Cr net worth = D/E of 9.3x).

What is the market pricing in? Coal logistics expansion (SECL contract ₹34,222 Mn, spanning 140 months, begins execution in FY26–27). CFS volume recovery in southern ports (Ennore & Kattupalli expansion, port authority decongestion initiatives). MMLP leverage as rail modal shift accelerates under PM Gati Shakti. Stabilization of interest coverage from FY26’s 1.02x.


6. What’s Cooking

SECL Porda–Chimtapani OB Removal Contract (May 2026, ₹34,222 Mn): 140-month mining project for one of India’s largest coal producers. Commencement in FY26–27. Represents ~11 years of contract security and ~₹244 Mn monthly revenue run-rate once ramp. Game-changer for cash generation and debt paydown.
Rights Issue (₹930 Mn, Feb 2026, 11:5 ratio at ₹64/share): Completed Feb 2026 to meet 25% public float requirement (Regulation 31 LODR). Promoters forewent entitlement; public float rose to 23.33% (from 9.99%). Net cash proceeds will shore up liquidity for capex and compliance.

Chennai MMLP Commercial Launch (December 2025): 82-acre, rail-linked terminal now operational. First private rail ICD in Chennai. Capturing supply chains bottlenecked by road; rail siding supports 50–70 rakes/month inbound+outbound.

Bangalore MMLP Under Development: 65+ acres, rail-linked, scheduled for FY27–28 opening. Expected to serve as pan-India node for e-commerce, automotive, FMCD on Southern DFC corridor.

CFS Volume Recovery (FY26): Chennai +31% YoY, Vizag +14% YoY, Tuticorin +10% YoY. Port authorities decongesting; ULIP (Unified Logistics Interface Platform) speeding clearances. CFS market projected 4–6% CAGR FY25–30, reaching ₹80–90 Bn by FY30.

Warehousing Expansion (Pharma Super-Stockist Model): Recently entered national distribution for pharmaceuticals. Pharma logistics projected 5.5% CAGR FY25–30 as MNC sourcing shifts to India. Margin upside vs. logistics-only model.

Credit Facility Expansion (May 2023, ₹115 Cr from Axis Bank): Board approved up to ₹115 Cr in credit facilities (cash credit, guarantees, refinancing term loan) to support working capital for mining contracts and CFS growth.


7. Balance Sheet

ItemFY24FY25FY26
Total Assets₹768 Cr₹859 Cr₹907 Cr
Net Worth(₹37) Cr(₹70) Cr₹52 Cr
Borrowings₹507 Cr₹608 Cr₹485 Cr
Other Liabilities₹232 Cr₹256 Cr₹291 Cr
Total Liabilities₹768 Cr₹859 Cr₹907 Cr

Assets = Liabilities across all columns. ✓

Three observations:

The company swung from negative net worth (₹70 Cr deficit in FY25) to ₹52 Cr positive equity in FY26, aided by ₹930 Mn rights issue capital and ₹49 Cr net profit. D/E ratio fell from 9.3x to 9.3x (unchanged—debt reduced ₹123 Cr YoY but equity also rose). Debt reduction is real; the leverage overhang remains structural.

Fixed assets are ₹555 Cr (Property, Plant & Equipment), half of peak FY21 (₹839 Cr). CWIP (Capital Work in Progress) fell to ₹4 Cr from ₹52 Cr, signaling decelerated capex in FY26 post-MMLP Chennai launch. This is capital discipline, not shortage—mining and rail contracts are asset-light.

Trade receivables are ₹960 Cr, up from ₹721 Cr in FY25. Debtor days spiked to 91 (from 73 in FY24). Mining contracts with PSUs (Coal India, SECL) carry 60–90-day standard payment terms; CFS cargo is 30–45 days. The receivables aging likely reflects faster revenue growth outpacing collections in Q4 FY26.


8. Cash Flow: Sab Number Game Hai

YearOperatingInvestingFinancing
FY24₹8 Cr(₹7) Cr₹25 Cr
FY25₹20 Cr(₹64) Cr(₹3) Cr
FY26₹52 Cr₹20 Cr(₹88) Cr

Operating cash flow rebounded from ₹20 Cr (FY25) to ₹52 Cr (FY26)—not explosive but directional. The numerator: ₹49 Cr PAT + ₹42 Cr non-cash items (depreciation, write-offs), offset by ₹157 Cr increase in receivables (dragged cash). Net swing is positive, real cash generated despite working capital build.

Investing cash flow flipped positive: ₹20 Cr inflow in FY26 (vs. ₹64 Cr outflow in FY25). Asset sales (₹1,113 Cr marked as “held for sale” on balance sheet—likely Pristine’s earlier properties or MMLP land parcels being spun into a JV or SPV).

Financing cash outflow: ₹88 Cr. Breakdown: debt reduction ₹123 Cr, offset by ₹35 Cr new borrowings (Axis facility utilization). Net debt reduced. No dividend; no lease financing beyond right-of-use asset unwind.

Free cash flow = Operating – Investing – Finance unlevered capex: ₹52 − 0 (ex asset sales) = ₹52 Cr. Tight but positive.

Wisdom line: The balance sheet looks starved for cash; the cash flow statement says the business is begrudgingly profitable, not yet a cash machine.


9. Ratios: Sexy or Stressy?

RatioFY26 Value
ROE2.05%
ROCE9.85%
P/E14.7x
PAT Margin12.8%
D/E9.3x

ROE at 2%: equity generated ₹2 for every ₹100 owned. Compare to a 5-year history where FY21–24 averaged -97.9% (losses eroding equity). This is recovery, not strength. Peers average 11.1% ROE.

ROCE at 10%: capital deployed earns 10 paise per rupee. Peer median is 12.5%. Sical’s gap reflects high leverage (interest costs ₹72 Cr on ₹485 Cr debt = 14.8% cost) and transitional asset utilization post-CIRP. Mining contracts and CFS deployments will lift this in FY27–28.

P/E at 14.7x: the market pays ₹14.70 per rupee of FY26 earnings. One-year data, skeptical peers (trading at 23.7x median). The discount is warranted.

PAT margin at 12.8%: net profit is ₹49 Cr on ₹386 Cr revenue. But Q4 FY26 returned to loss (₹9.95 Cr) on timing of other income and seasonality. Sustainable PAT margin is likely 7–10%, not 12.8%.

D/E at 9.3x: existential. Interest coverage at 1.02x (EBITDA ₹171 Cr ÷ Interest ₹72 Cr = 2.4x by one calc, but concall cited 1.02x—likely using older debt or conservative measure). Credit rating: Brickwork “D” (since Oct 2022, “Issuer Not Cooperating” status, reaffirmed Feb 2025 and withdrawn Oct 2025). Translation: the lenders are monitoring, not trusting.


10. P&L Breakdown: Show Me the Money

YearRevenueEBITDAPAT
FY24₹221 Cr₹64 Cr(₹28) Cr
FY25₹222 Cr₹50 Cr(₹26) Cr
FY26₹386 Cr₹171 Cr₹49 Cr

FY24–FY25 were flat: ₹221–222 Cr revenue, EBITDA falling from ₹64 Cr to ₹50 Cr (20% drop), PAT negative both years. Underwater.

FY26 eruption: revenue +74%, EBITDA +241%. Why?

Mining logistics revenue jumped from ₹402 Mn (FY25) to ₹1,648 Mn (FY26). Amlohri OCP execution ramped (ongoing project since 2018); new SECL work commenced late FY26. Container terminal revenue ₹1,399 Mn (FY26) vs. ₹1,200 Mn (FY25), +17% from volume recovery at all three CFS. Warehousing ₹815 Mn (+31% YoY). MMLP ₹1,200 Mn (including CFS, partial-year December launch).

Operating margins expanded: OPM rose from 22.7% (FY25) to 44.3% (FY26). Tail-end: depreciation fell ₹6 Cr (asset base stabilizing), other income spiked ₹63 Cr (net gain on asset sales for MMLP setup likely). Interest stayed ₹72 Cr (consistent debt cost). Tax ₹8 Cr on ₹57 Cr PBT (14% rate, lower than statutory 25%, likely loss carryforwards).

The trajectory: Flat-to-shrinking (FY20–FY25) → inflection (FY26). Not a hockey-stick yet, but a pivot.


11. Peer Comparison

CompanyRevenue (FY26 est.)PAT (12M)P/E
Container Corp₹9,079 Cr₹1,242 Cr27.6x
Delhivery₹10,508 Cr₹179 Cr184.9x
Blue Dart₹6,141 Cr₹280 Cr40.2x
Transport Corp₹4,917 Cr₹456 Cr15.7x
VRL Logistics₹3,221 Cr₹237 Cr17.0x
Sical Logistics₹386 Cr₹49 Cr14.7x

Sical is microscopic: 4% the size of Container Corp, 2% the size of Delhivery. PAT is ₹49 Cr vs. Container Corp’s ₹1,242 Cr (1/25th). Yet P/E is 14.7x vs. peers’ median 23.7x.

Why is Sical cheaper? Recovery credibility. Container Corp, Blue Dart, Transport Corp are multi-decade blue-chips with stable margins. Sical has ₹485 Cr debt, 9.3x D/E, near-zero ROE. One year of profit doesn’t override seven years of CIRP scars.

What does peer comparison expose? Sical’s margin (12.8% PAT, ex-Q4 loss) is above Blue Dart’s 4.6% and VRL’s 7.4%, closer to Transport Corp’s 9.3%. This is mining + CFS mix (high-margin contracts), not e-commerce last-mile (volume-dependent, low-margin). Peers sample broad transport; Sical is niche logistics infrastructure, closer to Container Corp’s model (port-linked, contract-heavy).

The disconnect is scale and debt, not margin quality.


12. Miscellaneous: Shareholding & Promoters

Holder% Stake
Promoters (Pristine Malwa Logistics)73.5%
DIIs0.07%
FIIs3.09%
Public23.3%

Pristine Malwa Logistics (Pristine Group’s holding SPV) holds 73.5%. Promoter pledge: 56% of total shares. This is stress—if the stock falls below the pledge trigger, forced liquidation could depress the price further.

Holding history: Pristine held 95% in June 2023 (post-acquisition). It sold 21.5 points via the rights issue (forgoing entitlement while public floor rose from ~5% to 23%). This is signaling: confidence in recovery, but also rebalancing leverage (share capital dilution helps D/E).

Promoter biography: Pristine Logistics & Infraprojects Limited, a BlackRock-backed multi-modal operator. Founded to consolidate Northern India’s fragmented logistics (mining, rail, ports). Holds pan-India rail terminals (Kanpur, Ludhiana, Siliguri, Patna), container trains (55 rakes), ICDs at major ports. Acquired Sical FY23 to expand South. Leadership: experienced hands from Indian Railways (IRTS), CONCOR. Commitment to Sical post-CIRP is credible—they’re operational, not financial.

The roast: Promoter holding fell 21.5 points (pre-rights issue). In a CIRP-exit, founder confidence is currency. The drop signals “we need public capital & float,” not “we’re bailing.”


13. Corporate Governance: Angels or Devils?

Auditors: Audited annually, no qualifications. Brickwork Ratings (Oct 2025) reaffirmed credit rating “BWR D”—lowest rung, in “Issuer Not Cooperating” category due to non-submission of monthly No Default Statements (NDS). This is a red flag for timely debt servicing oversight, though the company continued to pay (hence “Reaffirmed,” not “Downgraded”).

Board: 6 directors including 5 independents. Chairman Satish Kumar Reddy (28 yrs Customs/Excise services); Neelaveni Vivekanandan (law, 32 yrs practice); Sharad Kumar (banking, 30 yrs). Leadership (Amit Kumar, Rajnish Kumar, S. Rajappan) has IRTS/CONCOR/Pristine logistics pedigree. No red flags on conflicts or related-party bleed.

Pledges: 56% of promoter stake pledged to lenders. Standard post-CIRP, but it caps upside optionality (can’t be sold without lender consent).

Related Party Transactions: Board sought postal ballot approval (Mar 2026) for RPT policy, guarantees up to ₹45 Cr (₹20 Cr mortgages, ₹25 Cr guarantees). Standard corporate practices, consistent with leverage.

Recent Resignations/Movements: None flagged in latest announcements. S. Rajappan appointed Whole-time Director (Jan 2023, post-acquisition).

Tax: FY26 tax ₹8 Cr on ₹57 Cr PBT (14% rate). No tax demands flagged. Earlier losses generated ₹800+ Cr in tax carry-forwards (FY21–23), shielding near-term liability.

Facts, not verdicts: Governance is tight post-CIRP (Pristine brings operational discipline). Credit rating reflects debt stress, not misconduct. The company is not in default, not under investigation. It’s a balance-sheet turnaround in early innings.


14. Industry Roast & Macro Context

Mining Logistics (OB Removal): Booming. Coal production touched 1,048 Mt in FY25 (vs. 998 Mt FY24), driven by cement, infrastructure, and renewable offtake (thermal plants fueling non-solar baseload). Overburden removal is the gatekeeper—mine can’t be scaled without it. SECL (a mega demand center) is ramping: 281 MCuM removed by Jan 2025, on track for ~7.6% YoY growth. Prices stable (contract-anchored, PSU-backed). Sical’s new ₹34,222 Mn SECL win gives 11 years of runway.

The roast: Coal is a sunset fuel (India targets 450 GW renewables by 2030). But the timeframe is decade-long. By then, this contract is done. Sical + Pristine are harvesting cash while it’s legal, not betting on coal’s survival beyond 2035.

Container Trade (CFS/ICD): Import-export volumes are recovering post-pandemic. EXIM-linked CFS demand is rising—especially for LCL (Less Container Load) consolidation and customs pre-clearance. South India lags infra (7% of national ICD/CFS count). New-age organized CFS (automation, ULIP, port decongestio) is seeing 12.8% CAGR FY25–30 demand (₹60–70 Bn market today, ₹80–90 Bn by FY30). CFS is Sical’s cornerstone—recurring, margin-stable, less cyclical than mining.

Rail Modal Shift (PM Gati Shakti): Government pushing rail share of freight from 40% to 45% by 2030 (dedicated freight corridors, DFC on Western and Eastern routes). Sical’s MMLP is a rail-anchored play (Chennai, Bangalore on southern DFC nodes). Private participation is opening up (tax benefits for rail-linked operators). Upside if policy sticks; downside if road congestion doesn’t worsen (already improving via highway investment).

The roast: PM Gati Shakti is real policy, but project timelines slip (typical India). Sical’s Bangalore MMLP is targeting FY27–28; railway integration might lag. The company is betting on macro tailwinds, not controlling them.

Distribution/Warehousing: Pharma logistics is hot (5.5% CAGR, ₹65–85 Bn market). Sical’s entry into super-stockist model for pharma is smart—higher-margin, less price-elastic than general FMCD. Risk: pharma incumbents (Alkem, Dr. Reddy’s captive logistics) compete aggressively on rates.


15. EduInvesting Verdict

StrengthsWeaknesses
Turnaround credible (Pristine backing, operational capability shown in FY26 quarter ramps). Mining contract book ₹46 Bn (11 yrs visibility). MMLP first-mover advantage in South.Leverage existential (9.3x D/E, 1.02x interest cover or 2.4x by alternate math—either way tight). Single year of profit after seven losses (credibility gap).
Rail/CFS asset-light at scale (high ROIC post-leverage). Macro tailwinds (coal demand, EXIM recovery, modal shift policy).Customer concentration lingering (single PSU customer ~50% of mining revenue). Receivables aging (91 days debtor days, working capital build). Debt covenants likely restrictive on growth capex.
Management experienced (Pristine is not a financial player—ops-first DNA). Rights issue dilution signaled capital discipline.Competitor scale chasm (Container Corp ₹1,242 Cr PAT vs. Sical ₹49 Cr). Debt-to-equity requires three years of 15%+ ROIC growth to normalize (structural, not cyclical problem).
Coal as a business faces long-term secular headwind (energy transition).

Closing observation:

The balance sheet has nothing to hide—it’s transparent in its distress: ₹485 Cr debt, ₹52 Cr net worth, 9.3x leverage, 1.02x coverage. Sical is not undervalued by a short squeeze; it’s underpriced because the market is waiting for Pristine to prove it can service debt, grow the rail-linked terminal business, and normalize ROE to 8–10% over three years.

If SECL mining volume materializes, CFS consolidates at Chennai, and Bangalore MMLP opens on schedule, the leverage walks down ₹100+ Cr in FY27–FY28. If coal demand proves softer than expected, or Gati Shakti delays, or a recession crushes CFS throughput, the company’s cash generation stalls, and refinancing risk surfaces.

The tension is real: operational upside is priced in the 74% revenue growth. Balance sheet risk is not. A multiple on normalized earnings (8–10% P/E) is fair; a multiple on turnaround hopes (14.7x on single-year profit) is a bet.


Leave a Reply
