1. At a Glance
Steel? Yes. Power? Also yes. Debt? Almost none. Growth? Surprisingly resilient. Shyam Metalics is the dark horse in India’s steel arena—but its ROE is dragging its feet and dividend yields are thinner than steel sheets.
2. Introduction with Hook
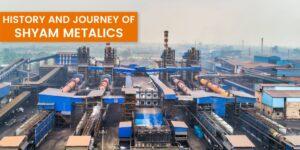
If Tata Steel is the flamboyant Bollywood superstar of the steel world, Shyam Metalics is the disciplined character actor who’s been grinding out hits in the background. From pellets to power, this Kolkata-based company has fingers in every metallurgical pie. And now with Rs. 7,500 crore of fundraising on the table, it looks ready to go full Bollywood blockbuster mode.
- Q1 FY26 Revenue: ₹4,419 Cr (+22% YoY)
- Q1 PAT: ₹291 Cr (+43% YoY)
- Market Cap: ₹26,089 Cr
- Net Debt: Negative (Yes, they’re chilling)
3. Business Model (WTF Do They Even Do?)
A full-stack steel manufacturing powerhouse:
- Pellets → Raw material
- Sponge Iron → 4th largest in India
- Ferro Alloys → Among top Indian producers
- TMT & Long Steel Products → Construction market staple
- Power Generation → Internal consumption + small sales
Fully backward integrated. They make what they sell, and they power the plants themselves. Like building your own JCB to dig your gold mine.
4. Financials Overview
Annual Trend (₹ Cr):
| Metric | FY22 | FY23 | FY24 | FY25 | TTM |
|---|---|---|---|---|---|
| Revenue | 10,394 | 12,658 | 13,195 | 15,138 | 15,945 |
| EBITDA | 2,601 | 1,499 | 1,570 | 1,866 | 1,957 |
| Net Profit | 1,724 | 843 | 1,029 | 909 | 924 |
| OPM % | 25% | 12% | 12% | 12% | 12% |
| EPS (₹) | 67.6 | 33.4 | 37.1 | 32.5 | 33.1 |
Takeaway:
- Margin halved post FY22 (commodity price peak?)
- Growth back in FY25. But margins still need protein shakes.
5. Valuation
| Metric | Value |
|---|---|
| CMP | ₹936 |
| EPS (TTM) | ₹33.11 |
| P/E | 28.3x |
| Book Value | ₹378 |
| P/B | 2.48x |
Fair Value Range (Based on Multiples):
- P/E @ 18–22x → ₹595 – ₹728
- P/B @ 1.8–2.2x → ₹680 – ₹831
Verdict: It’s running ahead of fair value. Market is pricing in expansion + dilution + infra boom optimism.
6. What’s Cooking – News, Triggers, Drama
- Q1 FY26 Revenue up 22%, Volume up 32%, EBITDA up 19%
- Interim Dividend ₹1.80 declared
- Rs. 4,500 Cr equity + Rs. 3,000 Cr NCDs planned
- Aggressive CapEx + expansion = dilution alert
- Power costs managed well, but carbon costs could rise soon
- Public shareholding tripled from 2023 to 2025
7. Balance Sheet
| Item | FY23 | FY24 | FY25 |
|---|---|---|---|
| Net Worth | ₹7,276 Cr | ₹9,647 Cr | ₹10,553 Cr |
| Borrowings | ₹1,172 Cr | ₹597 Cr | ₹789 Cr |
| CWIP | ₹2,769 Cr | ₹3,764 Cr | ₹2,708 Cr |
| Total Assets | ₹11,595 Cr | ₹14,393 Cr | ₹16,316 Cr |
Key Highlights:
- CWIP has been growing steadily → expansion in full throttle
- Net Debt-to-Equity close to zero
- Balance sheet still lean
8. Cash Flow – Sab Number Game Hai
| Year | CFO | CFI | CFF | Net Cash |
|---|---|---|---|---|
| FY23 | ₹1,518 Cr | -₹1,944 Cr | ₹424 Cr | -₹1 Cr |
| FY24 | ₹1,794 Cr | -₹2,762 Cr | ₹916 Cr | -₹51 Cr |
| FY25 | ₹1,964 Cr | -₹1,904 Cr | -₹36 Cr | ₹24 Cr |
Takeaway:
- Operationally sound
- Cash burn from capex
- Equity raise + NCDs makes sense if growth plans justify it
9. Ratios – Sexy or Stressy?
| Metric | FY23 | FY24 | FY25 |
|---|---|---|---|
| ROE | 12% | 11% | 9% |
| ROCE | 15% | 11% | 12% |
| Inventory Days | 90 | 84 | 100 |
| Debtor Days | 18 | 20 | 19 |
| CCC (days) | 45 | 12 | 21 |
Verdict:
- Decent efficiency
- ROE could use a gym membership
- Working capital tight and improving
10. P&L Breakdown – Show Me the Money
| Year | Sales | EBITDA | PAT | EPS | OPM % |
|---|---|---|---|---|---|
| FY23 | ₹12,658 Cr | ₹1,499 Cr | ₹843 Cr | ₹33.4 | 12% |
| FY24 | ₹13,195 Cr | ₹1,570 Cr | ₹1,029 Cr | ₹37.1 | 12% |
| FY25 | ₹15,138 Cr | ₹1,866 Cr | ₹909 Cr | ₹32.5 | 12% |
Sidenote:
Revenue growing. Margins static. PAT swinging = Pricing power limited.
11. Peer Comparison
| Company | P/E | ROE % | PAT (₹ Cr) | CMP / BV | Div Yld % |
|---|---|---|---|---|---|
| APL Apollo Tubes | 60.8 | 19.4 | 757.1 | 10.9x | 0.33% |
| Shyam Metalics | 28.3 | 9.0 | 924.0 | 2.5x | 0.48% |
| Welspun Corp | 20.0 | 18.5 | 1,206.5 | 3.2x | 0.55% |
| Ratnamani Metals | 36.2 | 16.0 | 541.6 | 5.4x | 0.50% |
| Jindal Saw | 9.8 | 13.7 | 1,473.1 | 1.3x | 0.89% |
Takeaway:
- Not the cheapest
- Not the most profitable
- Positioned in the “emerging leader” sweet spot
12. Miscellaneous – Shareholding, Promoters
| Group | Mar ’23 | Mar ’24 | Jun ’25 |
|---|---|---|---|
| Promoters | 88.35% | 74.59% | 74.59% |
| FIIs | 0.65% | 3.75% | 3.21% |
| DIIs | 3.14% | 7.68% | 8.73% |
| Public | 7.86% | 13.66% | 13.16% |
Observations:
- Promoters reduced 88% → 74%
- FIIs + DIIs quietly accumulating
- Retail also getting interested post FY24 breakout
13. EduInvesting Verdict™
Shyam Metalics is the quiet operator. No debt drama. No flashy press releases. Just steel, power, and now… equity dilution plans. While it’s priced ahead of fair value, the company is capexing for future leadership.
If they can pull off the ₹7,500 Cr fundraise without destroying ROE, this could be India’s next mid-cap steel czar.
But for now? Think of it as the Ranveer Singh of steel—plenty of energy, some erratic roles, but box office potential.
Metadata
– Written by EduInvesting Team | 23 July 2025
– Tags: Shyam Metalics, SHYAMMETL, Q1 FY26, Steel Stocks, Ferro Alloys, EduInvesting


