Shree Tirupati Balajee FIBC Ltd Q2 FY26 – From Jumbo Bags to Jumbo Drama: Revenues Slide 10%, Profits Collapse 74%, but Rights Issue Balloon Expands!
1. At a Glance
Let’s start with the punchline — the bag maker’s profits got bagged. Shree Tirupati Balajee FIBC Ltd (STB FIBC), the Indore-based manufacturer of HDPE and PP woven sacks and flexible bulk containers, just dropped its Q2 FY26 numbers, and the results are a mix of durability, duct tape, and drama.
For the quarter ended September 2025, revenue came in at ₹93.55 crore — down 10.4% QoQ — while PAT deflated sharply by 73.6% to ₹1.87 crore. The stock, priced at ₹817, trades at a sky-high P/E of 90.4, because clearly, gravity is optional in SME land. Market cap? ₹828 crore. Book value? ₹92.9 per share. Return on capital employed sits at a decent 15.5%, but when your earnings yield is 2.28%, the “premium” is clearly on hope, not cash.
Despite repeated profits, the company hasn’t paid a single rupee in dividends — because apparently, holding cash is the new investor reward. Promoter holding remains steady at 66.2%, while debt stands at ₹96.7 crore, making the debt-to-equity ratio a confident 1.03.
So, what do we have here? A company that builds big bags for industrial and export use — but its financials just sprang a leak. Let’s unpack what’s really going on.
2. Introduction
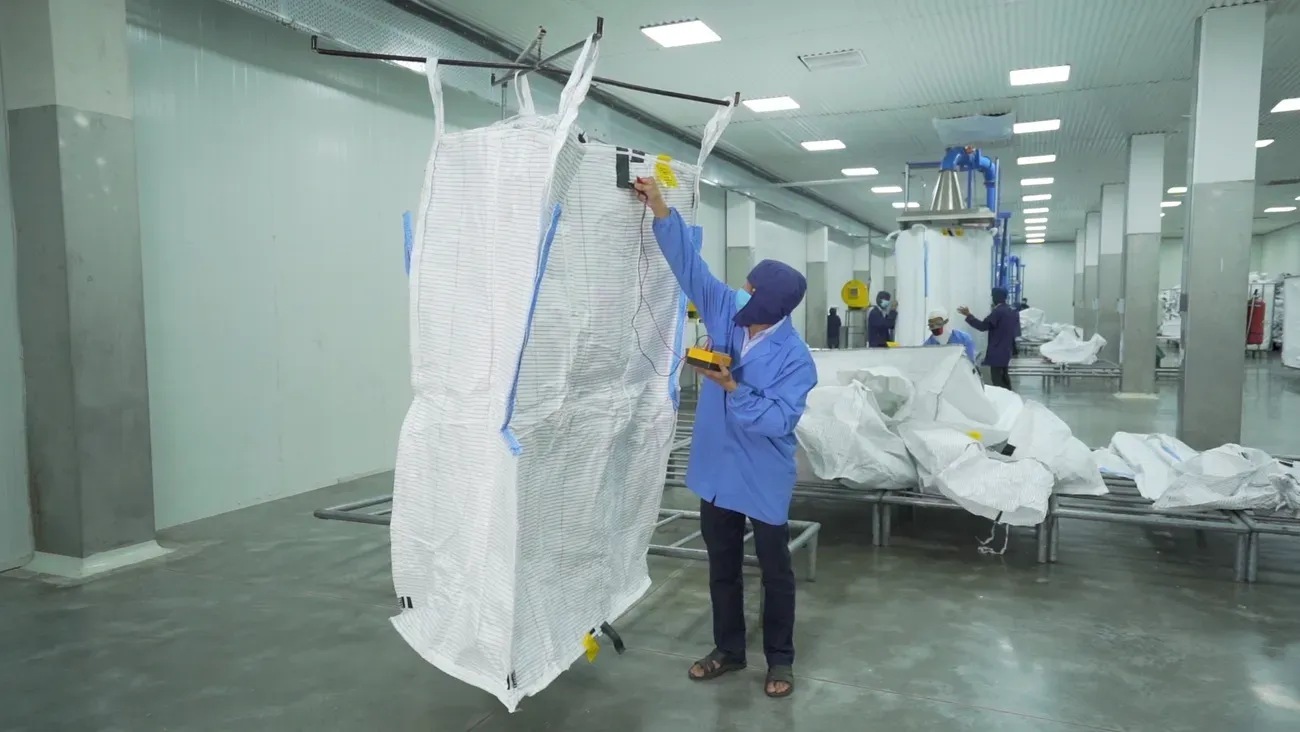
Welcome to the world of industrial packaging — where everything is flexible, except margins. Shree Tirupati Balajee FIBC Ltd has been around since 2009, making massive woven sacks and jumbo bags for storing and transporting bulk products like cement, chemicals, and food grains. Think of it as the muscle behind modern logistics: those giant cube-shaped bags you see in factories? That’s STB’s playground.
But FY26 hasn’t been particularly kind. Despite stable revenue and export reach across 55 countries, the bottom line slipped faster than a PP bag on a wet factory floor. Operating margins, once at 19% in the pandemic boom of FY23, have halved this quarter.
Meanwhile, the company’s rights issue of ₹25.73 crore approved in August 2025 aims to strengthen the balance sheet, expand capacity, and perhaps patch the growing holes in working capital.
And just when things were looking stuffed enough, a director resigned — citing “pre-occupation” — the corporate equivalent of “it’s not you, it’s me.”
Still, STB continues to be ISO 22000, 9001, and 14001 certified — which sounds great until you realize the real test isn’t certification; it’s sustained cash flow.
3. Business Model – WTF Do They Even Do?
Let’s make it simple: STB FIBC makes industrial bags. But not your average carry bag for onions. We’re talking about FIBCs (Flexible Intermediate Bulk Containers) — those one-ton capacity sacks used to move cement, polymers, fertilizers, and food grains worldwide.
Their product range includes everything from UN-certified conductive bags to form-stable baffle bags that don’t collapse like government projects. They also make tarpaulin rolls, container liners, and HDPE woven fabric, which is like the textile of the industrial world.
The company boasts an annual capacity of 8,000 MT for FIBC/Jumbo Bags and 4,000 MT for fabric — impressive until you notice that utilization swings widely depending on export orders.
And yes, they export to 55+ countries across Europe, the Middle East, and Africa — including the UK, Spain, and Germany. Basically, if there’s a factory storing bulk goods, there’s a chance one of STB’s bags is sitting there quietly doing its job — unlike the company’s share price last quarter.
Domestically, 93% of revenues come from the Indian market and only 7% from exports, which is ironic for a company that calls itself an “exporter.”
So yes, the business model is straightforward — manufacture, sell, and repeat — but like any packaging product, it’s all about the margins. And those have been getting thinner than their polypropylene yarn.
4. Financials Overview
Source table
Metric
Latest Qtr (Sep 2025)
Same Qtr Last Year (Sep 2024)
Prev Qtr (Jun 2025)
YoY %
QoQ %
Revenue (₹ Cr)
93.6
104.0
104.0
-10.0%
-10.4%
EBITDA (₹ Cr)
6.0
13.0
13.0
-53.8%
-53.8%
PAT (₹ Cr)
1.87
7.00
7.19
-73.3%
-73.6%
EPS (₹)
1.85
7.00
7.19
-73.6%
-74.2%
Annualized EPS = 1.85 × 4 = ₹7.4 → giving a P/E of ~110. So yes, P/E 90.4 from screener looks generous; mathematically, even that’s optimistic.
The earnings compression is real — sales down 10%, profits down 74%, and yet the stock is up 63% in the last 3 months. Either investors know something we don’t, or we’re in the SME version of Schrödinger’s rally.
5. Valuation Discussion – Fair Value Range Only
Method 1: P/E Multiple Approach
Industry average P/E = 22.1 Company P/E = 90.4 (unsustainably high) If normalized to 25×, fair value ≈ ₹7.4 EPS × 25