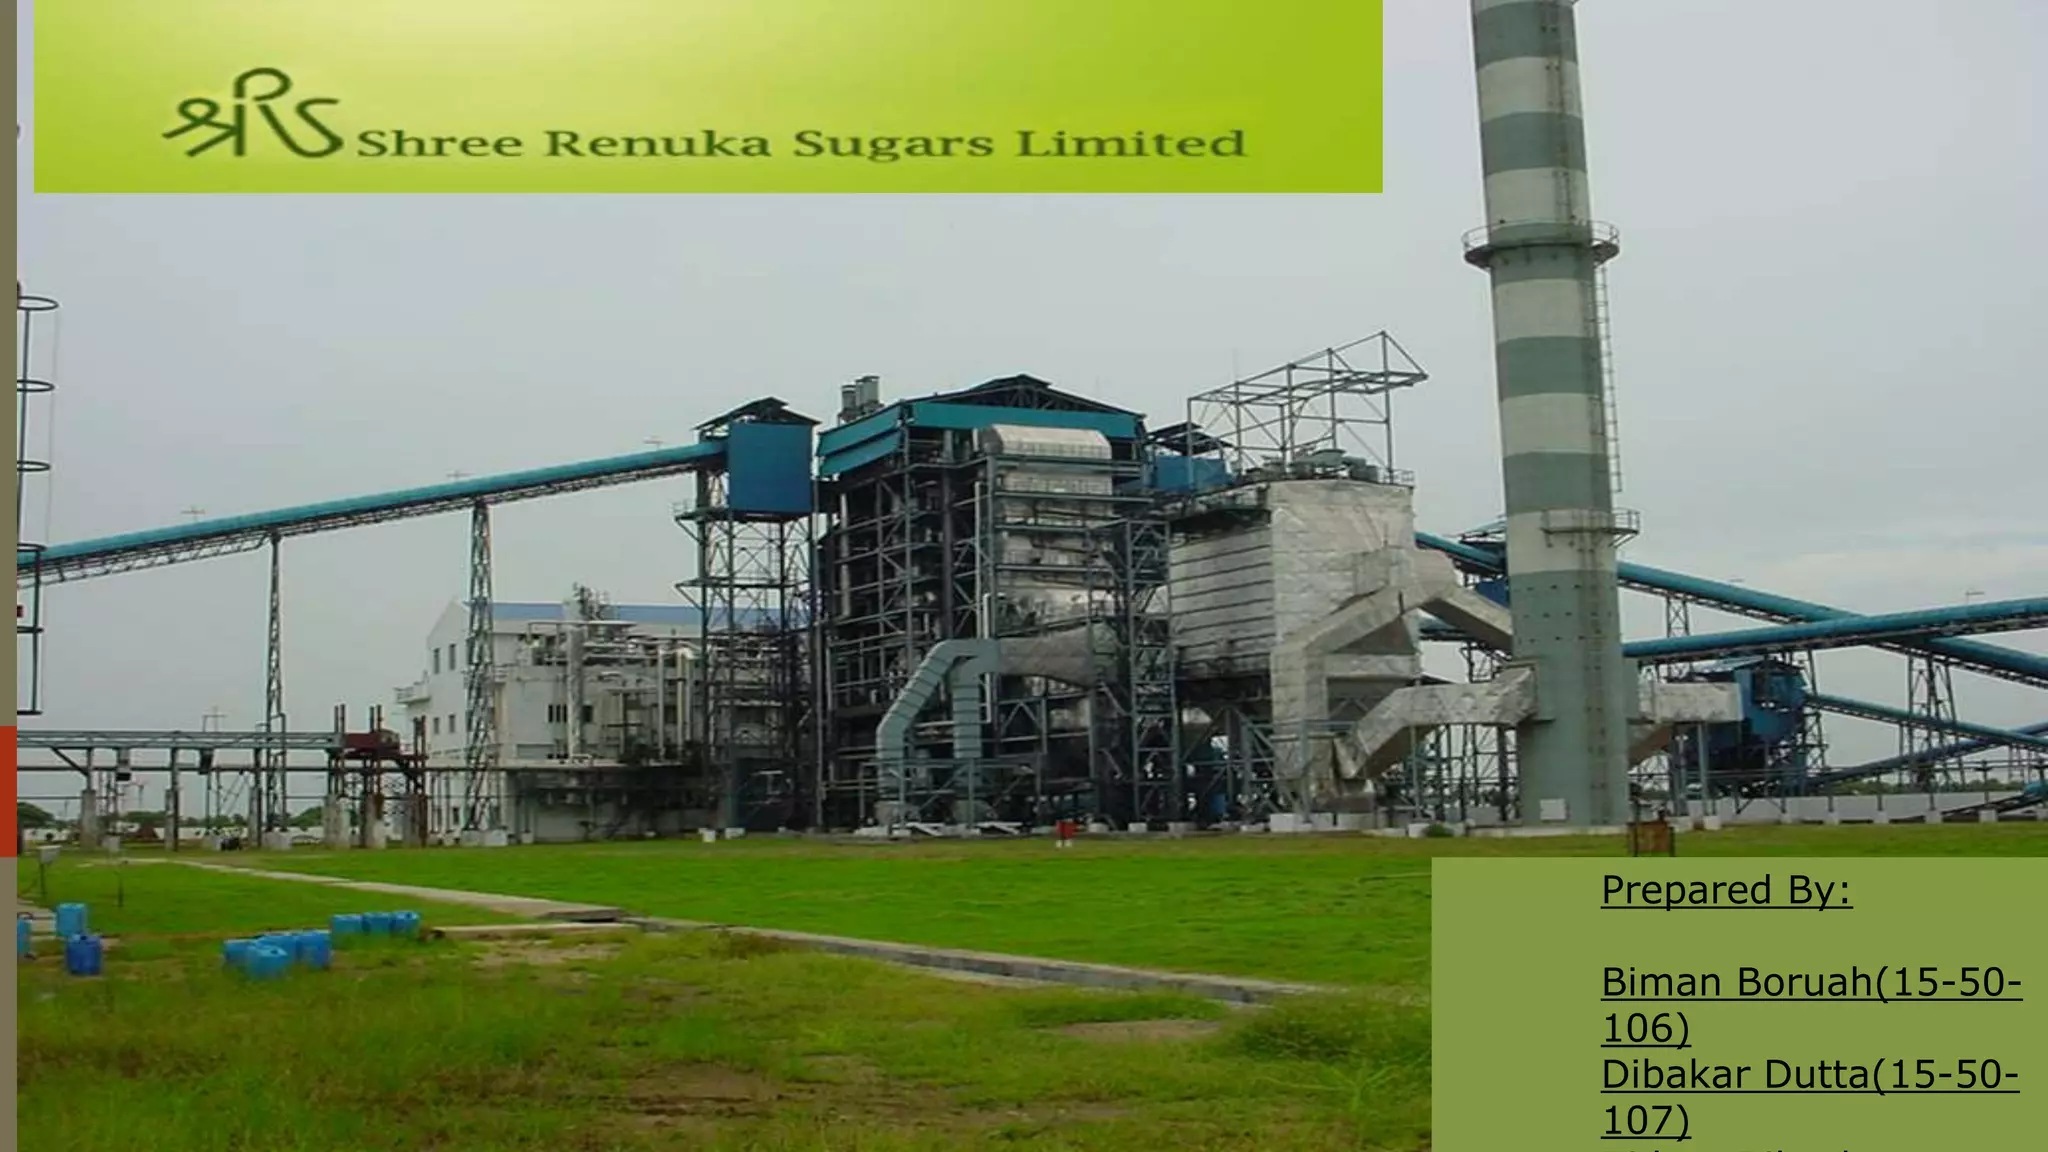
1. At a Glance
India’s sugar baron, Shree Renuka Sugars Ltd, is back in the news, not for a new festival of sweetness but for serving a full platter of financial indigestion. The company – once hailed as the “Wilmar of India” – reported an H1FY26 loss of ₹6,423 million, taking its net worth deeper into negative territory at ₹9,262 million. That’s right — your friendly neighbourhood mithaiwala technically has negative sugar in the tank.
With a market cap of ₹5,922 crore, a stock price of ₹27.8, and an EV/EBITDA of 74.5, this is one sugar stock where calories aren’t the problem — debt is. Its debt mountain stands at ₹6,266 crore, giving it a current ratio of 0.37 and an interest coverage of -0.16. That’s accountant-speak for “sir, EMI bharne ke liye bhi refinance karna padta hai.”
The company’s Q2FY26 consolidated sales came in at ₹2,423 crore, down 5.6% YoY, while losses ballooned to ₹369 crore – a 1,553% blow-up compared to the same quarter last year. Meanwhile, ROCE is 10.6%, which sounds cute until you remember that ROE is undefined, because well… there’s no equity left.
So the question is — can India’s fourth-largest sugar producer find sweetness again, or is it permanently stuck in a debt trap marinated in molasses?
2. Introduction – The Bitter Truth Coated in Crystals
There are two kinds of Indian companies in the sugar business: those that make money off sugar, and those that make news off it. Shree Renuka Sugars firmly belongs in the second category.
Founded in 1995, the company has built an empire that spans 8 mills in Karnataka, 2 massive refineries in Gujarat and West Bengal, 1,250 KLPD of distillery capacity, and 259 MW of co-gen power. On paper, it’s a vertically integrated sugar powerhouse. In practice, it’s an overleveraged refinery with a hangover.
The stock is currently down 35.4% YoY and 22% over three years, but up 23% in five years, which probably says more about market optimism than fundamentals. The company’s flagship ‘Madhur’ sugar brand commands roughly one-third of India’s branded sugar market, a statistic that should make FMCG giants jealous — if only it came with profits attached.
Meanwhile, its largest shareholder, Wilmar Sugar & Energy Pte Ltd, holds a commanding 62.5% stake, ensuring that global capital keeps the IV drip going while Indian investors keep praying for the turnaround that never turns.
3. Business Model – WTF Do They Even Do?
Let’s decode this syrupy maze. Shree Renuka Sugars operates across three main divisions, all of which are vital to its “sweet and smokey” revenue cocktail.
- Sugar Business (92% of Q1FY25 Revenue)
- This is the motherlode. The company runs sugar mills for domestic raw sugar production and massive refineries for export.
- Refining contributes nearly 70% of the sugar business and grew 116% between FY22 and FY24 thanks to higher realizations (₹27,913 per MT → ₹55,426 per MT).
- Milling fell due to weak cane availability – down from 5.67 Mn MT in FY22 to 4.6 Mn MT in FY24.
- Distillery (4% of revenue)
- Produces three grades of ethanol: rectified spirit, extra neutral alcohol, and absolute alcohol.
- Production slipped from 164.84 Mn liters (FY22) to 156.36 Mn liters (FY24) because of ethanol blending restrictions.
- Co-generation & Others (4%)
- Uses bagasse (sugarcane residue) and coal to generate power.
- Power sold to grids fell from 257 Mn units in FY22 to 177 Mn in FY24.
Basically, Shree Renuka Sugars tries to extract every last drop from the cane — sugar, ethanol, and power. Unfortunately, the only thing it seems to extract reliably these days is debt.
4. Financials Overview
Here’s how the company’s latest quarterly performance looks compared to the past: <table> <tr><th>Metric</th><th>Latest Qtr (Q2FY26)</th><th>YoY Qtr (Q2FY25)</th><th>Prev Qtr (Q1FY26)</th><th>YoY %</th><th>QoQ %</th></tr> <tr><td>Revenue (₹ Cr)</td><td>2,423</td><td>2,566</td><td>2,010</td><td>-5.6%</td><td>20.6%</td></tr> <tr><td>EBITDA (₹ Cr)</td><td>-182</td><td>227</td><td>-86</td><td>-180.1%</td><td>-111.6%</td></tr> <tr><td>PAT (₹ Cr)</td><td>-369</td><td>-23</td><td>-264</td><td>-1,504%</td><td>-39.8%</td></tr> <tr><td>EPS (₹)</td><td>-1.73</td><td>-0.10</td><td>-1.24</td><td>-1,630%</td><td>-39.5%</td></tr> </table>
If EBITDA were a cricket score, this innings would have ended with the team all out for -182. The company literally lost money at the operating level, which means it’s not even covering raw material and power costs.
Annualised EPS = (-1.73 × 4) = -₹6.92. With negative earnings, the P/E ratio is not meaningful (read: financially ghosted).
5. Valuation Discussion – Fair Value Range Only
Let’s try to find a “fair” range for something that’s been fairly unfair to shareholders.
a) P/E Method
Industry median P/E = ~20x (Balrampur, Dalmia Bharat, etc.)
But Renuka’s EPS = -₹6.92 → P/E not meaningful.
b) EV/EBITDA Method
- EV = ₹12,116 Cr
- EBITDA (FY25 TTM) = ₹22 Cr
EV/EBITDA = 12,116 / 22 = 550x (!!!)
Fair range assuming normalization = 8–12x → Implied EV = ₹176–₹264 Cr
So fair value per share range (approx) = ₹4–₹6
c) DCF (Simplified)
Assuming cash flows stabilize at ₹250 Cr annually post turnaround (very optimistic) and discounting at 12%:
→ PV ≈ ₹2,000–₹2,500 Cr
→ Equity value per share ≈ ₹9–₹11
✅ Fair Value Range (Educational Purpose Only): ₹4 to ₹11 per share
(This range is for educational discussion only and not investment advice.)
6. What’s Cooking – News, Triggers, Drama
When your press release section reads like a TV serial recap, you know drama’s brewing.
- H1FY26 Loss: ₹6,423 million and negative net worth of ₹9,262 million. That’s like burning all your sugar before Diwali.
- Loan to Equity Conversion: The company approved converting a ₹573.65 million loan into KBK equity — classic “convert kar lo warna likh do” maneuver.
- ESG Rating: Crisil gave it a “ESG Score 52”