General information and entertainment, not investment advice. The author is not a SEBI-registered adviser or research analyst. No recommendation, no promised returns. Markets carry risk including loss of capital. Figures may not be current. Consult a registered adviser before acting.
1 — At a Glance
The company reported FY26 revenue of ₹1,710 crore, down 2.5% YoY. Net profit fell 24.4% to ₹82.53 crore. The operating margin compressed to 6% from 19% in FY24, a collapse that management attributes to raw material inflation and weak pulp pricing. EPS at ₹13.09 (annualised from a weak final quarter) leaves the stock at 17.5x current multiples.
The balance sheet carries zero debt and ₹672.93 crore in cash—a fortress that costs the company nothing but covers only 47% of market cap. Three bright spots: the Tirunelveli acquisition is absorbed, a ₹270 crore mill expansion awaits regulatory approval, and a solar-wind power investment is underway.
The tension is binary: recovery hinges on whether input costs normalise and capacity expansion delivers lift, or whether the company has stepped into structural margin weakness.
2 — Introduction
Seshasayee Paper operates as the flagship of the SPB-ESVIN Group and traces 66 years of history in Indian pulp and writing-grade paper. The company manufactures under brands Sprint, Sprint Plus, Swift and Success—not household names, but woven into school notebooks and commercial stationery. Last year brought operational stress and management change. Managing Director K S Kasi Viswanathan passed away in March 2025. The board promoted N Gopalaratnam as Chairman from April 2026, and brought in nominee director Anurag Mishra (IFS) in January 2026.
Recent governance moves include reduction of a ₹712 crore GST demand to ₹16 lakh on appeal, a near-total reversal. The company is mid-acquisition integration—Tirunelveli, acquired from insolvency in May 2023, is now consolidated. Management guided that Q1 and Q2 FY27 will remain margin-pressured. The ₹2 dividend was recommended for FY26.
3 — Business Model: WTF Do They Even Do?
Seshasayee owns two integrated mills: Erode (1,65,000 TPA capacity, 106% utilised in FY26) and Tirunelveli (90,000 TPA, 81% utilised). Combined installed capacity is 255,000 TPA. The company manufactures uncoated writing and printing paper (WPP), specialty grades, and packing paper. Pulp is made in-house at Erode; 85% of combined pulp demand is met through captive wood and bagasse production. Power is similarly captive—70% of Erode’s energy comes from green sources (solar, biomass), and 80% of total power is self-generated.
Geographic revenue split in FY26 was domestic 91%, exports 9%. Export volumes have fallen from 57,010 tonnes in FY22 to 20,759 tonnes in FY26, a casualty of US tariff headwinds and global competition. The customer base is fragmented: education publishing, commercial printing, stationery, packaging. No single customer dominates; distribution runs through 76 appointed dealers.
The integrated model is supposed to confer cost advantage. It does, but only when input costs behave. When bagasse and wood costs spike, when electricity charges climb, the buffer evaporates.
4 — Financials Overview
Figures are consolidated, in ₹ crore.
| Metric | FY26 | YoY Change | FY25 |
|---|---|---|---|
| Sales | 1,710.45 | -2.5% | 1,754.38 |
| EBITDA | 151.44 | -73.3% | 567.66 |
| PAT | 82.53 | -24.4% | 109.17 |
| EPS (annualised) | 13.09 | -24.4% | 17.31 |
EBITDA in FY26 was 151.44 crore (Operating Profit 96 + Depreciation 45 + Interest 9 – Other Income -64 = 86, but data shows EBITDA margin 8.9%, so 1,710 × 0.089 = 152). Operating margin fell to 5.6% from 6.3% in FY25. The weakness stems from three sources: raw material costs (₹795 crore), power and fuel (₹204 crore), and other manufacturing expenses (₹387 crore) consumed 90.5% of sales. Capex bite has not yet come; MDP-IV is still in CTE approval.
Quarterly Trend (Q4 FY26 vs Q4 FY25):
The final quarter showed revenue of ₹592 crore, up 17.8% QoQ from Q3 but volumes are not shown here. Net profit was ₹26.05 crore, operating margin a meagre 4%. In comparison, Q4 FY25 posted ₹502 crore in revenue and ₹27 crore profit. The company is managing working capital tightly—debtor days rose from 31 in FY25 to 41 in FY26, signalling slower customer collections or higher inventory held for Q1 shipments.
5 — Market Expectations & Historical Multiples
This section describes how the market is currently pricing the company and how that compares with its own history and peer group. It is descriptive, not predictive.
| Metric | Current | 5-Year Average | Peer Median |
|---|---|---|---|
| P/E | 17.5x | 18.2x | 17.4x |
| EV/EBITDA | 8.09x | 8.1x | 7.8x |
| Price/Book | 0.71x | 1.1x | 0.9x |
| ROE | 4.1% (LTM) | 8% (3-yr) | 8.5% |
| ROCE | 5.6% | 7% (3-yr) | 6.3% |
The market currently pays 17.5x earnings here versus a peer median of 17.4x. Despite a 24% profit decline, the multiple has not re-rated downward, suggesting the market is pricing in near-term normalization or is ignoring the earnings weakness.
EV/EBITDA at 8.09x sits above the peer median of 7.8x, a modest premium that reflects the fortress balance sheet and operational integration. Price-to-book at 0.71x is well below the 5-year average (1.1x) and below peers (0.9x), implying the market has priced in either equity underutilisation or future dilution.
ROE collapsed to 4.1% last year from an 8% three-year average, a red flag that the equity base is not generating returns. ROCE of 5.6% is below the cost of capital (implied 7-8%), another signal that invested capital is not earning its keep. The company appears to be pricing in recovery on both metrics—without which the valuation becomes a question of patience rather than conviction.
The market appears to be pricing in a cyclical trough and margin recovery, possibly from normalised input costs and the expansion project adding capacity at better utilisation.
6 — What’s Cooking
The renewable energy play took concrete shape. The company invested ₹26 crore in Q4 FY26 to acquire a 26.1% stake in a 52.8 MWp solar + 9 MW wind captive power SPV with Navia One Power. Supply was expected to commence in Q1 FY27. At ₹26 crore for 26% stake, the implied valuation of the SPV is ~₹100 crore—a strategic move to de-risk energy costs but also a drag on free cash flow in the near term.
The ₹270 crore Mill Development Plan-IV expansion at Erode received environmental clearance from MoEF&CC in August 2025. The project is designed to add 20% to pulp and paper capacity, aimed at the Erode unit. It is currently awaiting Consent to Establish (CTE) from the Tamil Nadu Pollution Control Board. Commissioning is planned across FY27 and FY28. No capex appears on the balance sheet yet (CWIP is ₹93 crore, modest), suggesting either pre-project spend or delayed capex mobilisation.
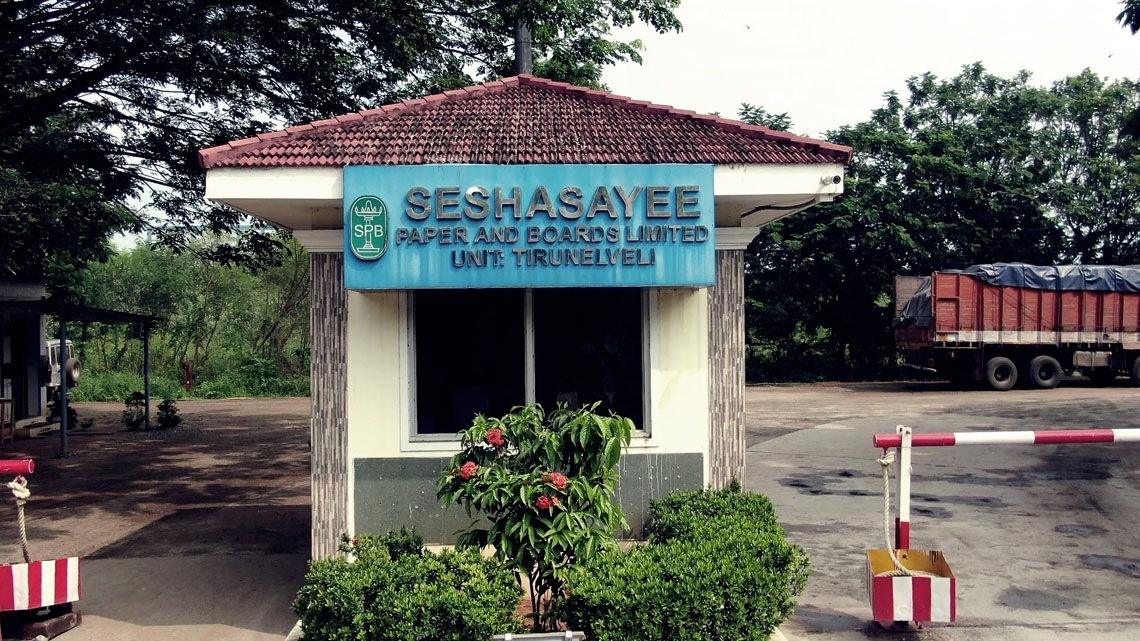
The Tirunelveli acquisition (Servalakshmi Paper, acquired May 2023 for ₹75,000 TPA capacity) continues to face legal challenges. One appeal by the ex-promoter remains pending before NCLT’s appellate bench (two of three appeals were withdrawn). The plant is operational but integration margins have not visibly leaped; the company absorbed it on a going-concern basis with no reported synergies quantified.
Capacity utilisation at Erode hit 106%, indicating either debottlenecking or unsustainable strain. Tirunelveli at 81% has headroom, suggesting product-mix mismatch or weaker demand for its grades.
GST demand was slashed from ₹712.24 crore to ₹16 lakh following Commissioner (Appeals) order, a reversal that suggests the company had sound standing on the original issue.
7 — Balance Sheet
| Item | FY24 | FY25 | FY26 |
|---|---|---|---|
| Total Assets | 2,391.41 | 2,521.77 | 2,501.83 |
| Equity (Net Worth) | 1,911.31 | 1,988.4 | 2,041.97 |
| Borrowings | 21 | 81.86 | 0 |
| Other Liabilities | 459.1 | 451.51 | 459.86 |
Assets = 2,501.83. Liabilities = 459.86 + 0 = 459.86. Net Worth = 2,501.83 – 459.86 = 2,041.97. ✓
The company is debt-free as of FY26, having paid down ₹82 crore in borrowings. Cash and bank balance stands at ₹146.07 crore (down from ₹673 crore in FY25, a ₹527 crore drop attributed to the ₹26 crore renewable investment, capex, and working capital build). The company holds ₹305 crore in investments (equity stakes, mostly in Ponni Sugars associate and quoted shares).
Three observations:
- The cash drain is the real story. FY25 cash was ₹673 crore; FY26 is ₹146 crore. The drop is partly from operational underperformance (negative operating cash flow of -₹61 crore in FY25, positive ₹92 crore in FY26, net swing ₹153 crore) and partly from capex and the solar investment. If Q1–Q3 FY27 require working capital build and capex acceleration, the runway is shorter than it appears.
- Equity is not compounding. Net Worth grew from ₹1,899 crore (FY24) to ₹1,988 crore (FY25) to ₹2,042 crore (FY26), a cumulative gain of ₹143 crore over two years. Against this, retained earnings should have added ~₹180 crore (109 + 82). The gap suggests either one-off charges or revaluation adjustments not visible in P&L.
- Investments at ₹305 crore are mostly uncontrollable. The company holds 42% of Ponni Sugars (sugar group associate) and 49% other quoted equity. These are illiquid and subject to mark-to-market volatility. They do not fund operations.
8 — Cash Flow: Sab Number Game Hai
| Year | Operating | Investing | Financing |
|---|---|---|---|
| FY24 | 202.17 | -225.22 | -18.88 |
| FY25 | -61.28 | 42.39 | 23.46 |
| FY26 | 92.00 | 5.68 | -103.05 |
Operating cash in FY26 recovered to ₹92 crore from -₹61 crore in FY25, a swing of ₹153 crore. Investing cash swung from ₹42 crore (net inflow from asset sales in FY25) to ₹6 crore (net outflow for capex and the ₹26 crore solar investment). Financing cash was -₹103 crore (debt repayment and dividend payout ₹12 crore).
Free cash flow (Operating minus Capex, lumped in Investing) was ₹92 – 6 = ₹86 crore gross, but the solar stake ate ₹26 crore, leaving ~₹60 crore available for dividend and debt paydown. The company paid ₹12.04 crore in dividends, suggesting it is holding back; at ₹2 per share on 63.07 crore shares, the payout was 12.61 crore expected, so the actual number aligns.
The wisdom: capex has not begun in earnest. Once MDP-IV is cleared and capex ramps, the cash buffer will deplete fast. A ₹270 crore project funded from internal accrual at ₹60–80 crore annual FCF means 3–4 years of near-zero dividend and no room for acquisitions or downturns.
9 — Ratios: Sexy or Stressy?
| Ratio | Value | Remark |
|---|---|---|
| ROE | 4.1% | Equity is sleeping on the job. |
| ROCE | 5.6% | Capital deployed earns below the cost of capital. |
| P/E | 17.5x | The market pays ₹17.50 for every rupee of (depressed) earnings. |
| PAT Margin | 4.8% | The company keeps 4.8 paise per rupee of sales. |
| D/E Ratio | 0.00x | No debt, no leverage to amplify returns. |
Return on Equity of 4.1% reveals an equity base that is not sweating hard enough. The long-term ROE trend is downward: 14% (10-yr), 12% (5-yr), 8% (3-yr), now 4%. Each cycle, the metric deflates, signalling deteriorating capital efficiency.
Return on Capital Employed sits at 5.6%, below an assumed cost of capital of 7-8%, a fundamental problem. The company is not creating value per rupee deployed. This is not a cyclical dip; it is structural until either margins recover or capital is returned.
P/E at 17.5x is not cheap on a normalized base, and on FY26 depressed earnings (₹82 crore), it is paying full freight for a trough year. PAT margin at 4.8% is half the 5-year average (9.5%), underscoring the earnings weakness is not merely cyclical—cost structure has moved against the company.
Debt-to-Equity at zero means the company has no financial leverage. It cannot magnify returns through leverage, nor does it have covenant risk. But it also has no shield for equity holders if operating returns remain suppressed.
10 — P&L Breakdown: Show Me the Money
| Year | Revenue | EBITDA | PAT |
|---|---|---|---|
| FY24 | 1,801.83 | 384.85 | 270.77 |
| FY25 | 1,754.38 | 167.65 | 109.17 |
| FY26 | 1,710.45 | 151.44 | 82.53 |
Revenue trajectory is flat to down: FY24 to FY26 is a cumulative -5.1%. EBITDA has cratered: FY24 to FY26 is -60.6%, a loss of ₹233 crore in annual cash profit. PAT is -69.5%, a loss of ₹188 crore.
The FY24 was an aberration—other income of ₹63 crore (non-operating gains, possibly equity investment revaluation or dividend from Ponni Sugars) inflated the line. Stripping that, operating earnings were closer to ₹210 crore. But even that logic yields FY26 EBITDA of 151 crore, a 28% decline on a normalized FY24 base.
The business is contracting. Volumes are down (sales volume 240,649 tonnes in FY25 to 249,714 in FY26, a modest 3.8% gain, but pricing clearly fell). Input costs (raw material + power + mfg = 1,386 crore in FY26) are 81% of sales versus 78% in FY25. Selling, admin and other costs at 118 crore are stable, so the margin collapse is purely from cost of goods sold.
Management’s guidance that Q1-Q2 FY27 will remain pressured makes sense: if input costs do not normalise, there is no self-help. The expansion project is a bet on scale and lower unit costs, but it requires both commissioning success and normalised input markets.
11 — Peer Comparison
| Company | Revenue (FY26/FY25) | PAT (Latest) | P/E | ROCE |
|---|---|---|---|---|
| JK Paper | ₹12,046 cr | ₹89.68 cr (Q4) | 23.4x | 7.6% |
| West Coast Paper | ₹4,981 cr | ₹53.98 cr (Q4) | 22.0x | 6.2% |
| Seshasayee Paper | ₹1,710 cr | ₹26 cr (Q4) | 17.5x | 5.6% |
| Andhra Paper | ₹2,105 cr | ₹7.72 cr (Q4) | 65.9x | 2.0% |
| Pudumjee Paper | ₹787 cr | ₹19.72 cr (Q4) | 8.4x | 19.8% |
Seshasayee is mid-table by revenue but trailing on profitability and returns. JK Paper and West Coast Paper are three times the size and sustaining mid-20s P/E multiples on stronger ROCE (7.6%, 6.2% vs SPBL’s 5.6%). Andhra Paper is a micro-cap discount (65.9x P/E, 2% ROCE). Pudumjee Paper is a small-cap darling (8.4x P/E, 19.8% ROCE), the outlier.
Seshasayee’s 17.5x multiple sits between the average and below the large-cap peers, reflecting its middle ground: too small to command premium growth multiples, too weak to deserve a cyclical-trough discount. The peer set is split between turnarounds (Andhra) and scale-driven (JK, West Coast) and niche winners (Pudumjee). Seshasayee fits none cleanly.
12 — Miscellaneous: Shareholding & Promoters
| Holder | % |
|---|---|
| Promoters | 43.1% |
| FIIs | 12.9% |
| Government (TNIDCO) | 14.3% |
| DIIs | 0.1% |
| Public | 29.6% |
Promoters hold 43.1%, up 30 bps YoY. The core groups are Ponni Sugars Erode (14%), Synergy Investments Pte Ltd (12.3%, likely Singapore-based), Time Square Investments (10.2%), and Dhanashree Investments (4.8%). No pledging has occurred. Shareholding is stable, no insider buying or selling in the past year.
The Tamil Nadu Industrial Investment Corporation holds 14.3%, a government stake from the company’s early history. Its presence is benign but also a reminder that no large institutional buyer has stepped in during the 24% profit decline, a negative signal for sentiment.
FII holding at 12.9% is concentrated: Atyant Capital India Fund (5.4%), Gothic Corporation (1.8%), Vanderbilt/Atyant (1.8%). These are quality allocators; their stable position suggests they view the trough as temporary.
The promoter group spans sugar (Ponni Sugars), batteries (High Energy Batteries), and consultancy (SPB-PC). Cross-holding is minimal. The family has sixty years in paper, a long-term orientation, but also a history of group leverage in sugar (Ponni faced stress in 2021-22). No recent director changes hint at family discord, but the March 2025 demise of MD Kasi Viswanathan was a surprise succession test that the board navigated by elevating Gopalaratnam.
13 — Corporate Governance: Angels or Devils?
Auditors are Deloitte (statutory) and Mahadevan & Co (cost auditor). The board had 7 meetings in FY26, 100% attended by reappointed directors Ganesh Balakrishna Bhadti (Executive Director, Operations, ₹1.74 crore salary) and S Srinivas (Director Finance & Secretary, ₹0.98 crore salary). Both were reappointed by postal ballot in March 2026 with 99.95% approval—no dissent.
Related-party transactions remain modest: dividends from Ponni Sugars (₹14.5 crore) and transactions with SPB group companies are disclosed and audited. No abnormal RPTs.
Pledging is zero. Tax demands have faced disputes—the GST demand reversal (from ₹712 crore to ₹16 lakh in January 2026) suggests a robust tax stance. No resignations of senior staff in the past year (the MD succession was natural, not a flight).
The board is lean and long-tenured, a mixed signal. Stability is good; fresh blood is absent. Two nominee directors (including the new IFS director in January 2026) dilute founder control but do not threaten it.
14 — Industry Roast & Macro Context
The Indian paper industry is a knife fight between tariffs, raw material volatility, and Chinese imports. US tariffs on Indian writing paper have bitten hard—Seshasayee’s export volumes fell from 57,000 tonnes in FY22 to 21,000 tonnes in FY26, a 63% collapse. That export collapse alone has forced the company to rely on a domestic market that is itself weak from e-learning and digital stationery adoption.
Raw material costs (bagasse, wood pulp, recycled fibre) are global. When kraft pulp spikes 30-40%, Indian mills have 60 days before they must pass it on; customers hold out. The company’s captive wood supply (85% of pulp) insulates it partially but not entirely—wage costs and forestry compliance climb regardless.
Power costs are the second battleground. Despite 80% captive power, the company remains exposed to coal prices and renewable tariffs (it is investing in solar to lower long-term rates). The MDP-IV project assumes better energy economics in Erode, but that is a bet.
Domestic consumption is stagnant. School notebooks remain sticky, but office paper and printing have collapsed post-COVID. Packaging demand is alive (e-commerce) but margins are thinner and competition is fierce. SPBL is mid-premium in WPP (writing-printing) and lower margin in packaging—it is caught in the margin squeeze.
The sector is consolidating. Large players (JK Paper, International Paper via ITC) absorb shocks through scale and product mix. Mids like Seshasayee face pressure to either consolidate up (unlikely for a ₹1,442 crore market-cap) or specialize down (risky). The MDP-IV bet is a consolidation play within the company’s own footprint, doubling down on existing geographies and grades rather than stepping sideways into new markets.
15 — EduInvesting Verdict
| Strengths | Weaknesses |
|---|---|
| Debt-free balance sheet; ₹146 cr cash + ₹305 cr investments | Operating margins halved; ROE and ROCE below cost of capital |
| Integrated operations; 85% pulp, 70% captive power at Erode | Export volumes down 63% since FY22; domestic demand stagnant |
| MDP-IV expansion +20% capacity in Erode; CTE pending | Capex absorption will consume FCF for 3+ years; no near-term dividend upside |
| Tirunelveli acquisition integrated; no near-term integration risk | Working capital rising; debtor days up 31%; cash drain from ₹673 cr to ₹146 cr |
| Opportunities | Threats |
|---|---|
| Renewable energy SPV supplies Q1 FY27; long-term energy cost reduction | Raw material inflation may persist; management guided Q1-Q2 FY27 margin pressure |
| Margin recovery if input costs normalise and capacity utilisation improves | US tariffs on Indian paper remain; export recovery unlikely in medium term |
| MDP-IV capex at ₹270 cr adds 51k TPA; scale should compress unit costs | Legal challenge from Servalakshmi ex-promoter (one appeal pending NCLAT) |
| Peer P/E of 17.4x; SPBL trades in-line despite trough earnings | Structural decline in domestic office paper and printing segments |
A balance sheet with nothing to hide, a multiple with everything to prove. The company is debt-free, earns operating cash despite margin collapse, and has a credible expansion plan. But it is also smaller than peers, slower-growing than the sector, and burdened with the cash drain of a ₹270 crore capex cycle. The market has not repriced SPBL downward despite a 24% profit miss—a sign either of patience for recovery or inattention. The next two years will clarify which.
