Search for Stocks /

RPP Infra Projects Ltd — FY2026: A ₹1,495 Crore Revenue Company That Forgot to Keep the Profit

Spotted a factual error — a wrong number, date, or fact? Tell us and we will check the source.

General information and entertainment, not investment advice. The author is not a SEBI-registered adviser or research analyst. No recommendation, no promised returns. Markets carry risk including loss of capital. Figures may not be current. Consult a registered adviser before acting.


1. At a Glance

RPP Infra Projects Limited closed FY2026 with consolidated revenue of ₹1,495 crore — a 4% advance on the prior year’s ₹1,439 crore. The headline, however, is not the top line. Consolidated PAT collapsed to ₹7.45 crore from ₹65.29 crore in FY2025, an 86% fall. Operating profit margin compressed to 1% from 7% the year before. EBITDA, which had recovered to ₹99 crore in FY2025, landed at ₹15 crore for FY2026 on the consolidated P&L.

The balance sheet carries borrowings of ₹105 crore (consolidated) against a net worth of approximately ₹535 crore, keeping gearing comfortable. The order book stood at ₹3,750 crore as of March 2026 — roughly 2.5x annual revenue — per the investor presentation, providing a forward workload that gives the company structural ballast even as current earnings have compressed severely.

ROCE, which touched 23% in FY2024, sits at 4.94% for FY2026. ROE, three-year average of 9.43%, landed at 1.74% for the year. The market currently prices the company at 35x earnings, a multiple that assumes the present year’s PAT is a trough, not a trend.

The company has a credit rating of CRISIL BBB+/Stable — a meaningful institutional attestation to financial risk profile even in a weak earnings year.

A ₹3,750 crore order book feeding a ₹15 crore EBITDA machine is either a timing mismatch or a structural puzzle — FY2027 will offer the answer.


2. Introduction

RPP Infra Projects Limited was incorporated in 1995 as R P P Construction Pvt Ltd, reconstituted as a public limited company in 2010, and listed on both BSE (533284) and NSE (RPPINFRA). Headquartered in Erode, Tamil Nadu — with its corporate office now in Mylapore, Chennai — the company operates as an integrated EPC contractor executing civil construction across roads, bridges, irrigation, buildings, water supply systems, and power infrastructure.

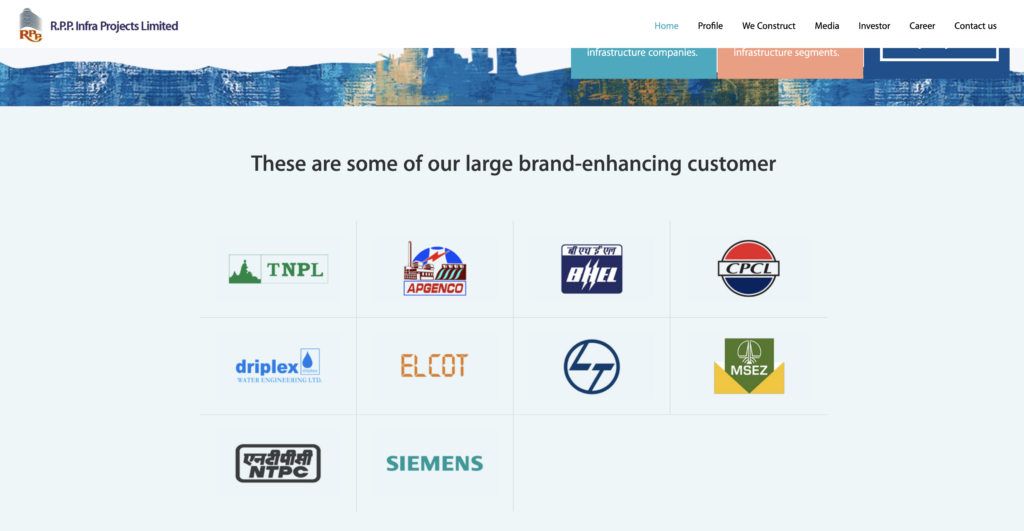
The company has executed over 200 civil construction projects spanning South India, Maharashtra, Madhya Pradesh, Uttar Pradesh, and Chhattisgarh. Its client roster includes NTPC, L&T, CPCL, TNPL, Siemens, APGENCO, and ELCOT. The business model straddles direct (self-executed) work and back-to-back subcontracting, and the balance between those two modes drove much of FY2026’s financial story.

FY2026 was an active year on the corporate calendar beyond financials. The board saw two independent directors resign in November 2025, a gap that persisted until January 2026 — a period during which the board was not duly constituted per SEBI norms, per the secretarial compliance report. K Jagannathan was subsequently appointed as an independent director, and Venkatesan Elliah Naidu was named CEO in April 2026. A compounding order was received from the income-tax authorities in February 2026, with fees of ₹72.17 lakh (for FY2018-19) and ₹15.44 lakh (for FY2022-23). A prosecution was also sanctioned in December 2025 for delayed TDS of ₹1.91 crore, with two directors named. All these items are noted in the announcements without management having provided a detailed public resolution narrative.

The company also entered a real estate project in Sri Lanka through an SPV — RPP Realtors Private Limited — with a stated saleable value of around ₹750 crore. Per CRISIL’s April 2026 note, piling approval was received and preliminary work was underway, though building permit approval was still outstanding as of the investor presentation date.


3. Business Model: WTF Do They Even Do?

RPP Infra is, in the most literal sense, a company that builds things for governments. Roads, bridges, water pipelines, irrigation systems, power plant structural works, buildings, hospitals — the portfolio reads like a public capital expenditure wish list. The company calls itself an integrated EPC contractor, which means it takes a project from engineering through procurement to construction, rather than being a pure subcontractor or a pure developer.

Three segments define the business. Infrastructure (roads, elevated corridors, power structures, Smart City projects, coal/ash handling systems) has historically been the largest contributor — roughly 60% of the order book as of FY2024. Water Management (Jal Jeevan Mission projects, water supply distribution, elevated service reservoirs, irrigation rehabilitation) had grown to 30% of the mix. Buildings and other (affordable housing, hospitals, social infrastructure) round it out at around 10%.

The geographic footprint has expanded beyond South India. CRISIL noted, as of the April 2026 report, that roughly 50% of orders were from Uttar Pradesh, around 20% from Tamil Nadu, and the remaining 30% from Maharashtra, Jharkhand, Karnataka, Chhattisgarh, Kerala, and Rajasthan. This diversification is explicit and deliberate — it partially insulates the company from policy shifts in any single state government.

What makes the model interesting, and occasionally messy, is the dual execution mode. The company runs some projects directly with its own workforce and equipment; it subcontracts others entirely to third parties and manages the oversight. In FY2026, management stated that subcontract revenue increased rapidly while self-executed work declined — per the investor presentation — because several newly awarded projects (including those with BHEL) were in their early stages and not yet contributing meaningful revenue, even as establishment costs had already been incurred. A category error, essentially: costs booked now, revenue to follow later.

The company’s stated focus is on projects under ₹250 crore in size with execution timelines under 24 months, targeting 12-13% EBITDA. FY2026 delivered 1% consolidated OPM — a significant departure from that stated target, though management frames it as a transitional period rather than an abandonment of the model.

Running a ₹1,495 crore construction business on a 1% operating margin is like sprinting a marathon in flip-flops — technically possible, briefly.

Does a ₹3,750 crore order book automatically translate into the margins the company is targeting, or is the project mix now structurally different from what the model assumes?


4. Financials Overview

Figures are consolidated, in ₹ crore.

Annual Results (FY2026 vs FY2025)

MetricFY2026FY2025YoY Change
Revenue1,4951,439+3.9%
EBITDA1599-84.8%
PAT7.4565.29-88.6%
EPS (₹)1.5013.17-88.6%

EBITDA is computed as PBT (₹10.74 crore) + Interest (₹16.47 crore) + Depreciation (₹8.15 crore) = ₹35.36 crore. Note: the screener shows operating profit of ₹15 crore, which excludes other income. Both figures are real; the ₹15 crore reflects operating profit from construction activity alone; the ₹35 crore includes the pre-tax build-up.

Management Commentary (Investor Presentation, June 2026)

Management attributed the PAT decline to four factors: a substantial shift in revenue mix from own-executed to back-to-back subcontracted projects; projects being in their early stages (including BHEL-related projects) and not yet contributing meaningful revenue while establishment costs were already incurred; several ongoing projects nearing completion and contributing lower incremental revenue; and significant increases in material, fuel, transportation, and labour costs. Management stated these losses are “exceptional and largely non-recurring” and projected that Q1 FY2027 profit would be modest, with significant revenue contribution expected only from Q2 FY2027 onwards.
CRISIL’s April 2026 note separately cited “higher establishment costs” as higher numbers of projects started under own execution during Q3 FY2026, leading to margin compression to approximately 1.5% in Q3 FY2026 from 7.5% in the same period the prior year.


5. Market Expectations & Historical Multiples

This section describes how the market is currently pricing the company and how that compares with its own history and peer group. It is descriptive, not predictive.

MetricCurrentHistorical AveragePeer Median
P/E35x18x (119-co. median)
EV/EBITDA10.6x
P/B0.61x
ROCE4.94%~15% (10yr avg)14.57%
ROE1.74%8% (10yr avg)

Note: Historical P/E average is not available from the data. ROCE 10-year average is computed from the ratio table (12%, 16%, 16%, 19%, 18%, 15%, 11%, 8%, 13%, 23%, 20%, 5%) as approximately 15%.

The market currently pays 35x earnings here against a sector median of 18x for 119 comparable companies. On book value, the multiple sits at 0.61x — the equity trades below net worth. EV/EBITDA of 10.6x reflects the EBITDA compression rather than market enthusiasm.

The market appears to be pricing in a recovery in earnings from FY2026’s depressed base — specifically, that the ₹3,750 crore order book (roughly 2.5x annual revenue) will convert into normalised margins in the near-to-medium term, and that the FY2026 PAT of ₹7.45 crore represents a trough. The 0.61x book value, by contrast, reflects the market’s residual skepticism about how quickly that normalisation arrives. These two signals point in opposite directions: a high earnings multiple and a sub-book price level can coexist only if the market is simultaneously discounting the earnings number and anchoring on asset value.

ROCE at 4.94% sits well below the company’s own 10-year average of approximately 15% and the peer median of 14.57%.


6. What’s Cooking

The investor presentation (June 2026) disclosed that the company was awarded 11 new projects worth ₹2,470 crore during the period up to March 2026 — comprising 9 infrastructure projects (₹2,096 crore), 1 buildings project (₹8 crore), and 1 water management project (₹366 crore). The cumulative order book as of March 2026 stands at ₹3,750.83 crore across 39 projects.

On the Sri Lanka real estate front, the SPV received piling approval and was commencing piling work, though the final building permit from local and state authorities remained pending as of the investor presentation.

In February 2026, RPP received a ₹205.89 crore EPC order from SDAT for the Global Sports City, Chennai — an 18-month contract. A ₹52.17 crore flood-mitigation order from Tamil Nadu WRD and a ₹66.26 crore roofing shed order from IPRCL for New Mangalore Port were also received during the year.

On the governance calendar: a compounding order with fees of approximately ₹87.62 lakh in aggregate (FY2018-19 and FY2022-23) was received in February 2026. A designated person was directed to disgorge ₹4,28,560 in profits from contra trades — the amount was remitted to IPEF.


7. Balance Sheet

Figures are consolidated, in ₹ crore.

ItemMar 2024Mar 2025Mar 2026
Total Assets8339531,035
Net Worth426530535
Borrowings4144105
Other Liabilities366380395
Total Liabilities8339531,035 ✓

Borrowings nearly tripled from ₹44 crore to ₹105 crore in FY2026, per the data sheet — the financing cash flow (₹65.92 crore proceeds from borrowings, per the consolidated statement) explains the move, likely tied to working capital needs and capex (fixed assets expanded from ₹92 crore to ₹132 crore).

Three observations on the numbers:

  • Borrowings at ₹105 crore against net worth of ₹535 crore keeps D/E at 0.20x — the leverage remains light, though the direction in FY2026 was upward.
  • Other assets (the large working capital pool) grew to ₹872 crore (standalone) — this is where the money lives and where the risk lives; it is not on the liability side.
  • Total assets of ₹1,035 crore for a company generating ₹7.45 crore PAT implies the asset base is, for now, working quite gently.

The balance sheet has more patience than the income statement.

One wisdom drop: In capital-light businesses, ROCE falls when revenue stalls. In asset-heavy businesses, ROCE falls when assets accumulate faster than revenue. Here it’s the earnings numerator that collapsed — the denominator grew modestly.


8. Cash Flow: Sab Number Game Hai

Figures are consolidated, in ₹ crore.

YearOperatingInvestingFinancing
FY202444-0-42
FY20258-4217
FY20267856

Operating cash flow has been quietly deteriorating — ₹44 crore in FY2024, ₹8 crore in FY2025, ₹7 crore in FY2026. The business is generating operating cash, but barely. FY2026’s positive investing inflow reflects proceeds from investments and interest received rather than asset sales of note. Financing inflows of ₹56 crore reflect the increase in borrowings during the year, net of interest paid of ₹16.47 crore.

Net cash and cash equivalents improved to approximately ₹93 crore (consolidated) at March 2026 from ₹22 crore at the start of the year — but this was substantially funded by the borrowing draw-down rather than operations.

Cash in the bank is always comforting. The question is which door it came through.


9. Ratios: Sexy or Stressy?

RatioValue
ROE1.74%
ROCE4.94%
P/E35.4x
PAT Margin0.50% (consolidated)
D/E0.20x

ROE at 1.74% — the equity is doing a convincing impression of a savings account. ROCE at 4.94% is the lowest in a decade, with the ratio table showing the last time it was this low was FY2022 (8%) and prior to that FY2021 (11%) — so 4.94% is the weakest reading in the visible history.

PAT margin at 0.50% on consolidated revenue makes the business nearly invisible at the bottom line. One more quarter of negative PAT territory (Q4 FY2026 consolidated net loss was ₹13.13 crore) and the full-year number would have been negative.

D/E at 0.20x is the one ratio working in the company’s favour — the balance sheet is not leveraged, which provides operational and financial flexibility.

The market pays 35x earnings on a 0.50% PAT margin. That arithmetic requires future earnings to be substantially different from present earnings for the multiple to resolve sensibly.


10. P&L Breakdown: Show Me the Money

Figures are consolidated, in ₹ crore.

YearRevenueEBITDA (PBT+Int+Dep)PAT
FY20241,35311457
FY20251,43911665
FY20261,495357

Revenue has compounded at 24% over five years — from ₹600 crore in FY2020 to ₹1,495 crore in FY2026. The top line has been a consistent success story. EBITDA, however, moved in the opposite direction over the same period: OPM was 9% in FY2020 and 1% in FY2026.

The decoupling of revenue growth and profitability is the defining financial characteristic of RPP Infra’s recent history. Three years ago, ROCE was 23% and the business was harvesting the operational leverage from its revenue ramp. FY2026 arrived with higher sub-contractor costs (₹1,003 crore on a ₹1,495 crore revenue base, or 67% of revenue) absorbing nearly all margin. Management attributed this to project-stage timing, per the investor presentation.

Sub-contractor work bills as a percentage of revenue: FY2024: ₹741 crore / ₹1,353 crore = 55%; FY2025: ₹741 crore / ₹1,439 crore = 51%; FY2026: ₹1,004 crore / ₹1,495 crore = 67%. The shift is arithmetically clear — when sub-contracting intensity rises and establishment costs for new projects are front-loaded, the margin compresses without a corresponding revenue dip.


11. Peer Comparison

CompanyRevenue (Qtr, ₹ Cr)PAT (Qtr, ₹ Cr)P/E
Larsen & Toubro82,7626,13335x
Rail Vikas Nigam6,69618257x
NBCC4,56025444x
IRB Infrastructure1,92729629x
Kalpataru Projects7,77843124x
Cemindia Project2,97324235x
Central Mine Planning82718830x
RPP Infra452-1335x
Peer Median (119 cos)18x

The market pays 35x for RPP Infra — the same multiple it pays for L&T, a ₹5.75 lakh crore company with consistent double-digit margins. Rail Vikas Nigam, with a ₹50,000 crore market cap, trades at 57x. NBCC, with 31% ROCE, trades at 44x. RPP Infra at 35x sits at the high end of the mid-cap peer band despite posting a quarterly PAT of negative ₹13 crore.

The sector median across 119 companies is 18x. RPP Infra trades at nearly twice the sector median. The gap between RPP Infra’s current operating metrics and the multiple the market assigns it is the central analytical fact of this peer section.

ROCE of 4.94% at 35x P/E is either a thesis about the future or a question that hasn’t been answered yet.


12. Miscellaneous: Shareholding & Promoters

Holder% (Mar 2026)
Promoters39.18%
Institutions (FIIs + DIIs)0.13%
Public60.68%

Promoter holding fell from 51.01% in March 2025 to 39.18% in June 2025 — a decline of approximately 12 percentage points in a single quarter. The filings show the redistribution among promoter family members: Arulsundaram Nithya’s holding reduced from ~15.53% to 7.50%, while Tharunya N A’s holding increased from ~0.11% to 8.18%. This is a reclassification within the promoter group rather than a sale to outsiders, but the net promoter percentage at the group level declined — the three-year change is -12.1%.

Public holding at 60.68% is unusually high for a promoter-family-managed company, and institutional interest is negligible at 0.13% combined.

R P Arulsundaram — chairman and managing director — has approximately three decades of experience in civil works for power, commercial buildings, and irrigation, per CRISIL. His wife, A Nithya, serves as Whole Time Director and CFO, a dual role that is not uncommon at mid-cap family-managed businesses and is not separately commented upon by the auditors. The board also approved RPT limit enhancement with Repplen Projects Private Limited, and a postal ballot was initiated to seek shareholder approval for the same — the limit was proposed to be raised to ₹850 crore.

When your related-party transaction limit is ₹850 crore and your annual PAT is ₹7 crore, the arithmetic merits a slow, considered read.


13. Corporate Governance: Angels or Devils?

The governance record for FY2026 has several entries.

The secretarial compliance report (May 2026) cited a BSE fine of ₹29,500 for delayed submission of related-party transaction disclosures for the half-year ended September 2025. The same report noted that from November 18, 2025, to January 14, 2026, the board was not duly constituted per SEBI’s Regulation 17(1)(b) — the company lacked the required independent director composition for approximately two months. A QR code required in newspaper publication of financial results for H1 FY2026 was also missing.

A designated person executed contra trades within a six-month window (buying in June 2025, selling in September–December 2025), in violation of SEBI’s insider trading regulations. The Audit Committee directed disgorgement of ₹4,28,560 to IPEF, which was completed. The company stated it has implemented measures to prevent recurrence.

An income-tax prosecution was sanctioned in December 2025 for delayed TDS of ₹1,91,82,542, with two directors named. A compounding order was received in February 2026, with total fees of approximately ₹87.62 lakh for FY2018-19 and FY2022-23 matters.

Auditors KRSG Associates issued an unmodified opinion on both standalone and consolidated FY2026 results. No going-concern qualification was raised.

The record shows a company managing a cluster of compliance lapses — none individually catastrophic, but collectively generating administrative and regulatory friction. The board’s response to each item has been corrective: disgorgement was executed, new CS appointed, new independent directors inducted.


14. Industry Roast & Macro Context

Indian infrastructure construction: the sector where governments announce projects with great fanfare, release funds with great delay, change specifications mid-project with great enthusiasm, and then ask contractors why costs went up. The EPC business model in this environment is essentially a negotiation between a tender price set in optimism and execution costs set by reality — and reality has been running warm on material, fuel, transportation, and labour costs, as management dutifully noted.

The Jal Jeevan Mission, Smart Cities, road widening programs, and power infrastructure buildout are genuine multi-year spending commitments — the order pipeline is real, and RPP Infra’s ₹3,750 crore book confirms it is capturing work. The challenge is that capturing work and converting it into earnings are two different sports. Subcontracting is the industry’s pressure valve: when you want to show execution speed, you subcontract; when you want to show margins, you self-execute. Doing both simultaneously, in a mix that shifts quarter to quarter, produces exactly the earnings volatility visible in this P&L.

Competition is intense, tender-based, and populated with both large players (L&T, Kalpataru) and small unorganised operators who will underbid anyone. Price escalation clauses exist in most contracts, per CRISIL, which provides a partial buffer — but “partial” is the operative word when sub-contractor labour and material costs sprint ahead of escalation indices.

The Sri Lanka real estate venture is the sector’s less-discussed cousin: a ₹750 crore saleable-value project, funded 50% by debt, in a country that has spent recent years managing a significant macroeconomic crisis. Construction companies diversifying into overseas real estate at this particular juncture is a career move with memorable downside scenarios.


15. EduInvesting Verdict

StrengthsWeaknesses
₹3,750 crore order book, ~2.5x revenue, providing 24-36 month visibilityPAT down 86% YoY; OPM at 1% against stated target of 12-13%
CRISIL BBB+/Stable rating reaffirmed April 2026Promoter holding at 39.18%, down ~12 ppt over three years; 26.8% pledged
D/E at 0.20x; net worth ₹535 crore; financial flexibility intactMultiple governance lapses in FY2026: board gap, contra trade, tax prosecution
200+ projects executed; geographic diversification across 7+ statesSub-contractor cost at 67% of revenue; own-execution model in transition
OpportunitiesThreats
Government capex in roads, water, smart cities continues; company is positioned in all threeSri Lanka real estate project (₹750 crore saleable value, 50% debt-funded) carries execution, funding, and macroeconomic risk
Recovery in self-executed project contribution from Q2 FY2027, per managementRPT limit with Repplen Projects proposed at ₹850 crore against ₹7 crore annual PAT requires shareholder vigilance
Bharat Heavy Electricals-related projects in early stage; establishment costs already incurred, revenue to followSustained margin compression — if the project-mix normalisation management describes does not arrive in FY2027, the narrative shifts from “trough” to “trend”

An order book that is 2.5x revenue and a PAT that is 0.5% of that same revenue — this is a company carrying two stories simultaneously, and FY2027 will have the casting vote on which one is true.