Search for Stocks /

Rikhav Securities FY26: ₹1,976 Cr of Revenue, ₹19 Cr of Profit, and a Word That Changed Meaning

Spotted a factual error — a wrong number, date, or fact? Tell us and we will check the source.

General information and entertainment, not investment advice. The author is not a SEBI-registered adviser or research analyst. No recommendation, no promised returns. Markets carry risk including loss of capital. Figures may not be current. Consult a registered adviser before acting.


1 — At a Glance

Rikhav Securities reported FY26 revenue of ₹1,976 Cr, up from ₹328 Cr a year earlier — a sixfold jump. Net profit for the same year: ₹19.04 Cr, down from ₹23.93 Cr. Revenue multiplied; profit shrank. That gap is the entire story, and it resolves into a single accounting decision rather than a business explosion.

The operating margin tells the same tale from the other side: 0.86% for the full year, against 11% the year before and 50% two years before that. A brokerage does not usually run a sub-1% margin. A firm booking the gross value of traded stock as revenue does.

Underneath sits a balance sheet holding ₹237 Cr of cash and bank balances against ₹7.89 Cr of borrowings, and a market capitalisation of ₹178 Cr — smaller than the cash pile. A promoter open offer for 26% of the company landed in April 2026. A credit rating went on negative watch in February. The numbers are loud; several of them are describing the same few events twice.


2 — Introduction

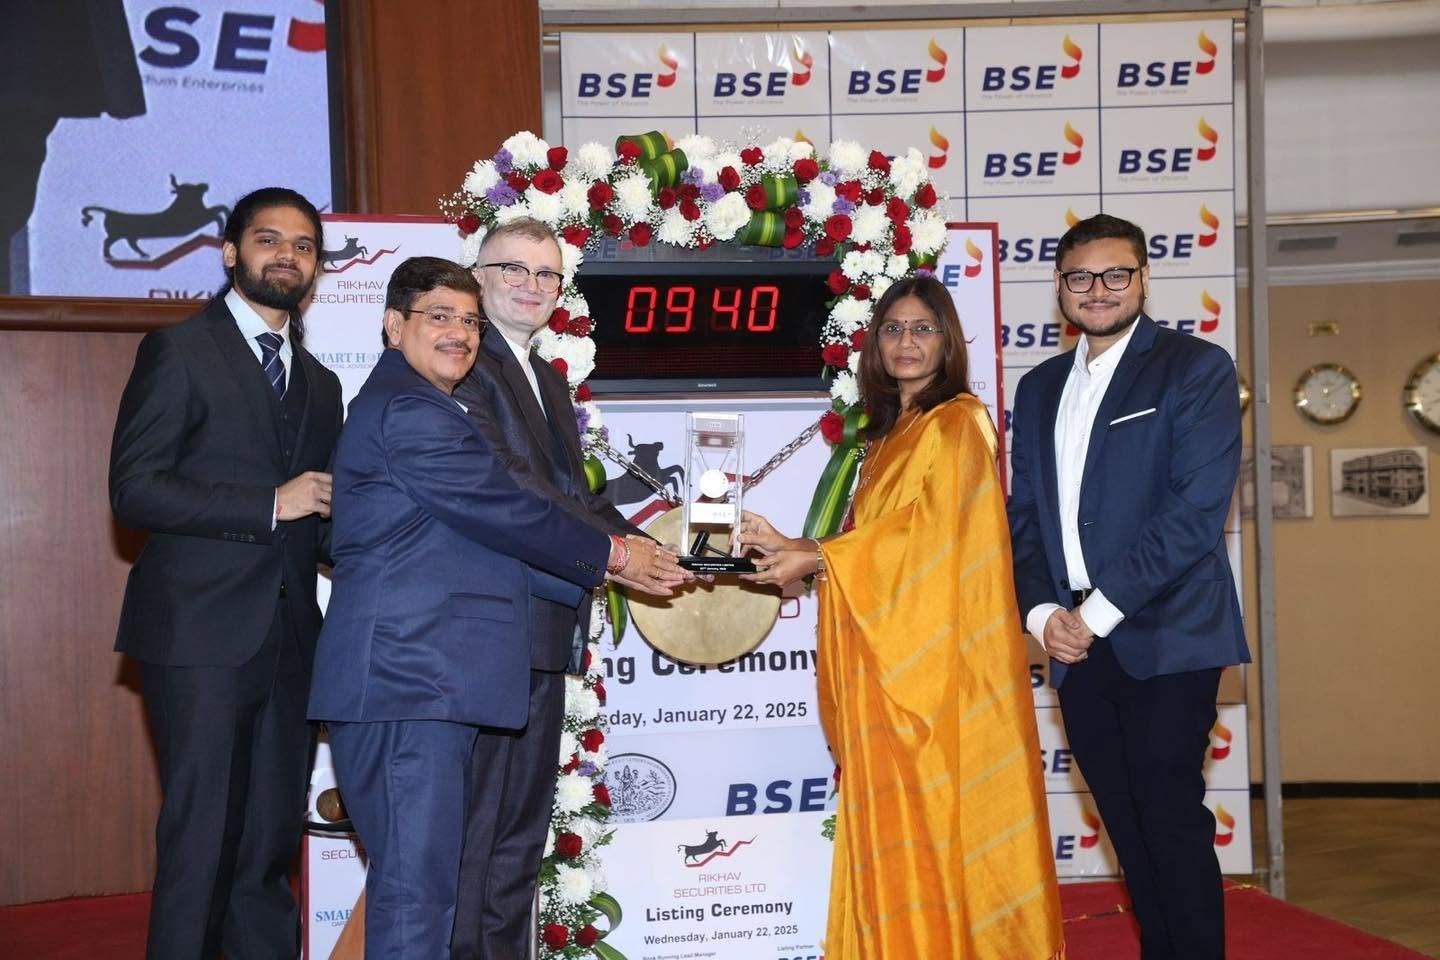
Rikhav Securities Limited was incorporated in 1995 as Brijmohan Sagarmal Finance Limited and renamed in 2006. It is a SEBI-registered broker with memberships across BSE, NSE and MCX, offering equity broking, derivatives, currency, commodities, depository services, market-making for SME IPOs, mutual fund distribution and a margin trading facility. It listed on the BSE SME platform on January 22, 2025, raising ₹88.82 Cr.

The recent chapter is busy. FY26 audited results were approved on May 23, 2026. In April 2026 the promoter group announced an open offer for up to 26% of the company. In February 2026, Infomerics placed the firm’s short-term bank facility ratings on watch following an RBI draft circular affecting funding for proprietary trading.

That last point matters more than it looks. Per the Infomerics report, roughly 92% of the company’s FY25 revenue came from proprietary trading and investment activities, with brokerage contributing 4.41%. This is a broker whose broking is a rounding error next to its own trading book.


3 — Business Model: WTF Do They Even Do?

On paper, Rikhav is a full-service financial platform: equity and F&O broking, currency, commodities, depository services via CDSL, MTF, mutual fund distribution, and IPO market-making for SMEs. The Rikhav Plus app, Aadhaar e-KYC onboarding, a VaR-based risk framework — the full modern-broker starter kit is present and accounted for.

But the revenue mix, per the presentation, is blunt: FY25 business and investment activities were 92.00% of income, brokerage and commission 4.41%, demat and other income 3.59%. The customer-facing broking business — the app, the client base, the 99% retention the marketing loves — sits on top of what is functionally a proprietary trading desk that also happens to have retail plumbing.

The prop desk runs algorithm-driven arbitrage, delta-hedging and short-term strategies on the firm’s own capital, aiming, in the presentation’s words, for disciplined mid-teens returns. Market-making supports around 46 SME IPOs a year, providing two-way quotes to keep newly listed small-caps liquid.

So the answer to “what do they do” is: they trade their own book, and they run a broker on the side. The presentation calls this diversified. A stricter reading calls it concentrated in one line with several hobbies. When 92% of revenue leans on prop trading, does the client-facing platform describe the business — or decorate it?


4 — Financials Overview

Figures are standalone, in ₹ crore. The reporting cadence is half-yearly; the latest period is H2 FY26 (the six months to March 2026).

MetricH2 FY26H2 FY25 (YoY)H1 FY26 (Prev Half)
Revenue1,596225380
Operating Profit-2-3719
PAT1.18-26.8517.86
EPS (₹)0.31-9.364.66

The second half swung to a razor-thin ₹1.18 Cr profit from a ₹26.85 Cr loss a year earlier — an improvement, though on a revenue line that grew sevenfold in the same window. Operating profit stayed negative in H2 while H1 carried the year’s real earnings.

On the concall, management attributed FY26’s profitability drag to a loss on cash-market shares of older investments, quantified in the press release at ₹22.93 Cr, plus ₹4.33 Cr of unrealised SLBM gains not yet recognised. Management also stated the year-end valuation was hit by weak markets on March 31, and separately said accounting classification changed from October 2024 — turnover previously shown as investment now shown as purchases/turnover, making the figure “not comparable.” That reclassification is what the revenue line is really reporting.


5 — Market Expectations & Historical Multiples

This section describes how the market is currently pricing the company and how that compares with its own history and peer group. It is descriptive, not predictive.

MetricCurrentHistorical AveragePeer Median
P/E9.3721.98
P/B0.73
ROE (%)8.0717.6 (5-yr)
ROCE (%)13.124.75 (FY23–26 avg)13.12
EV/EBITDA-1.56

The market currently pays 9.37x earnings here, against a peer median of 21.98x. The P/B of 0.73 places the market’s price below the company’s stated book value of ₹64.1 per share. Current ROE of 8.07% sits below its own five-year average of 17.6% — by the arithmetic above, roughly nine points lower. The EV/EBITDA is negative because, per the data sheet, cash and bank balances of ₹237 Cr exceed the ₹178 Cr market cap, producing a negative enterprise value.

What the market appears to be pricing in is the collapse in reported profitability — PAT down two years running and margins near zero — set against a near-debt-free balance sheet loaded with cash. The below-peer multiple and sub-book price track a company whose earnings quality and revenue definition both shifted in the same year. One factual observation on market expectations: the multiple and the price-to-book both sit below the company’s own history and its peer set, and both moved as the profit line fell.


6 — What’s Cooking

Three real items, all from filings.

First, the open offer. In April 2026 the promoter group — Hitesh Lakhani, Deep Lakhani, Vaishali Shah, Bharti Lakhani and persons acting in concert — announced an offer for up to 99,55,920 shares (26% of voting capital) at ₹47.75 per share, total consideration up to ₹47.54 Cr. The group had recently bought ~32.51 lakh shares (8.48%) through market purchases. The filing states no change in management or control.

Second, the credit action. Infomerics placed the ₹360 Cr of rated short-term bank facilities on Rating Watch with Negative Implications in February 2026, citing an RBI draft circular that raises the margin on bank guarantees for proprietary trading exposure to 100% from 50%.

Third, a non-event that filed anyway: in September 2025 the board decided not to acquire 49,980 shares (99.96%) of RSL Insurance Brokers. A deal announced by its own cancellation.


7 — Balance Sheet

ItemFY24FY25FY26
Total Assets293.56290.57398.44
Net Worth138.31226.54245.58
Borrowings40.100.117.89
Other Liabilities115.1563.92144.97
Total Liabilities293.56290.57398.44

Assets equal liabilities in every column.

  • Net worth climbed from ₹138 Cr to ₹246 Cr across two years, ₹88.82 Cr of that from the FY25 IPO.
  • Borrowings went from ₹40 Cr to near-zero to ₹7.89 Cr — a debt line that can’t sit still.
  • Other liabilities jumped ₹81 Cr in FY26; the press release attributes ₹47.34 Cr of the increase to SLBM borrowings.

Net cash stands at roughly ₹229 Cr (₹237 Cr cash and bank against ₹7.89 Cr debt) — a figure larger than the whole company’s market value. A balance sheet can be over-capitalised and still under-earn. Does ₹229 Cr of net cash fix an 8% ROE, or just fund the wait?


8 — Cash Flow: Sab Number Game Hai

YearOperatingInvestingFinancing
FY24104.99-93.83-2.75
FY25-187.13139.7318.33
FY2665.47-6.742.47

Operating cash flow reads like a heart monitor: +₹105 Cr, then -₹187 Cr, then +₹65 Cr. For a firm that trades securities as its main activity, working capital and inventory swings dominate the operating line — the FY25 plunge tracks the ₹111 Cr of inventory that appeared that year. Cash generation here says less about profit and more about what the trading book was holding on March 31.


9 — Ratios: Sexy or Stressy?

RatioValue
ROE8.07%
ROCE13.1%
P/E9.37
PAT Margin0.96%
D/E0.03

ROE of 8.07% means the equity base is working part-time; it earned nearly 18% on average over five years and has since clocked out. ROCE of 13.1% has more than halved from FY24’s 39%. The PAT margin of 0.96% is what happens when a ₹1,976 Cr revenue line is mostly gross trading turnover — the profit is real, the denominator is inflated. D/E of 0.03 confirms the balance sheet carries almost no debt; the leverage here is operational, not financial.


10 — P&L Breakdown: Show Me the Money

YearRevenueOperating ProfitOther IncomePATEPS (₹)
FY24110.38550.0742.3728.28
FY25327.8735023.936.25
FY261,975.961715.6519.044.97

The Other Income column earns its keep in FY26: ₹15.65 Cr of non-operating income against ₹17 Cr of operating profit. Nearly half of the earnings before financing costs is not the operating business — it is other income doing heavy lifting while operating profit slides from ₹55 Cr to ₹17 Cr over two years.

On EPS: FY24’s ₹28.28 falling to FY25’s ₹6.25 overstates the profit drop, because the share count roughly doubled — the adjusted share base moved from about 1.5 Cr to 3.83 Cr shares after the January 2025 IPO. PAT fell 44% that year; EPS fell harder because it was split across more shares. The business shrank; dilution amplified how it looked per share.


11 — Peer Comparison

CompanySales (Qtr)PAT (Qtr)P/E
Angel One1,459320.2433.85
IIFL Capital644115.1218.92
Share India Sec.41658.0412.71
Rikhav Securities1,5961.189.37

The table shows the reclassification problem in one glance. Rikhav’s quarterly sales of ₹1,596 Cr top every peer listed, including Angel One — yet its quarterly PAT of ₹1.18 Cr is a fraction of Share India’s ₹58 Cr on a smaller sales base. The lowest P/E in the set pairs with the thinnest profit on the largest revenue line. Same industry, entirely different revenue arithmetic.


12 — Miscellaneous: Shareholding & Promoters

Holder% (Mar 2026)
Promoters64.06
Institutions1.70
Public34.23

Promoter holding slipped 0.51% over the prior quarter (64.56% to 64.06%). Institutional holding is thin — FIIs at 0.58%, DIIs at 1.12%. The Chairman & Managing Director, Hitesh Himatlal Lakhani, is a Chartered Accountant with 40+ years in the trade; Rajendra N. Shah serves as Whole-Time Director and CFO. Notably, 16.6% of promoter holding is pledged — a detail worth holding alongside the promoter open offer bought at ₹47.75 while the promoters were also pledging.


13 — Corporate Governance: Angels or Devils?

The FY26 results carried an unmodified audit opinion from AHSP & Co LLP (formerly Patel Palkar & Associates). The related-party schedule lists routine dealings with group entities — office rent to Virang, Rikhav and AHL Investment Consultants, professional fees to Parth Investment Consultants, and amenities charges of ₹12.84 lakh to Rikhav Insurance Brokers — alongside salaries to promoter family members including Vaishali Shah, Aayushi Shah and Deep Lakhani. The pledged 16.6% of promoter stake and the CFO change in February 2025 are on record. These are disclosed facts, not findings; the auditor signed clean.


14 — Industry Roast & Macro Context

Indian broking is a cyclical, hyper-competitive business where large discount players compress margins and regulation moves the goalposts mid-game. The specific goalpost here is real: an RBI draft circular proposing that banks charge 100% margin on guarantees for proprietary trading, up from 50%, and stop financing securities acquisition by capital-market intermediaries. For a firm deriving ~92% of revenue from prop trading, the sector’s regulatory weather is not background noise — it is the forecast. SME market-making adds a second exposure: liquidity support for tiny new listings is lucrative until the SME segment freezes, at which point the market-maker is holding the inventory nobody wants.


15 — EduInvesting Verdict

StrengthsWeaknesses
Near debt-free; ₹229 Cr net cashROE down to 8% from 18% five-yr avg
P/B below stated book value0.86% operating margin; profit falling
Unmodified audit; IPO-strengthened net worth92% revenue from prop trading
OpportunitiesThreats
Institutional and MTF build-outRBI draft circular on prop funding
Cash pile to redeploy16.6% promoter pledge; SME inventory risk

FY26 gave Rikhav a revenue line that septupled and a profit line that shrank, and both trace to the same source: a business that trades its own book and, from October 2024, started reporting the gross turnover of that book as sales. A company priced below its own cash, carrying strong reserves and a weak return on them, with a promoter open offer on one side and a regulator’s draft circular on the other. The cash is real; the ₹1,976 Cr is mostly definitional. A balance sheet with money to spare, and an income statement still deciding what its own top line means.

Leave a Reply