


At a Glance
Responsive Industries, the PVC emperor of synthetic leather and luxury vinyl planks, just filed Q1 FY26 results. Consolidated net profit shot to ₹4,986 Cr (YoY growth +10%), with revenue at ₹339 Cr (down 5% QoQ). Operating margin stayed at a healthy 21%, but debtor days of 150 remind us this company loves giving customers endless credit. Stock at ₹225 trades at 30x P/E—so investors are paying a premium for a company whose cash flow says, “Bro, chill.”
Introduction
Imagine making synthetic leather for cars, vinyl flooring for rich homes, and waterproof membranes for God knows what, yet investors still yawn. Responsive Industries is that quiet stock—low dividend, low drama, high promoter holding. But Q1 FY26 numbers prove it’s not asleep. Profit continues to flex, margins are robust, but the stock price has taken a 22% hit over the past year.
The market’s question? Is this PVC powerhouse just flexible in products, or also in growth?
Business Model (WTF Do They Even Do?)
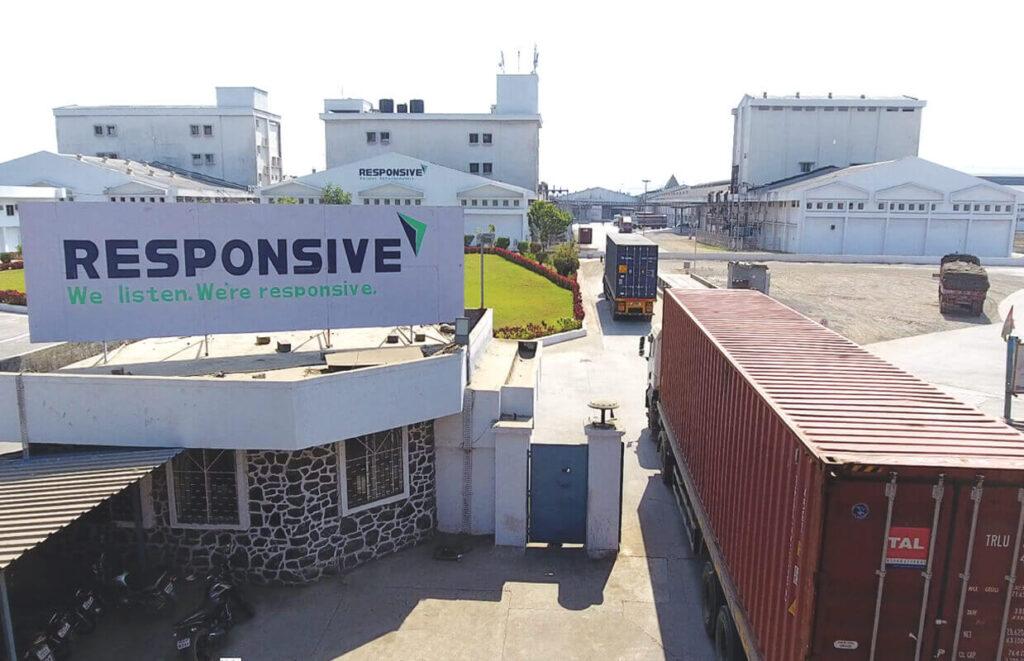
Responsive Industries manufactures PVC-based products—think synthetic leather, vinyl planks, sheets, and ropes.
- Automotive: Car seats, interiors.
- Healthcare: Hospital flooring and furniture.
- Residential & Commercial: Luxury vinyl flooring.
- Industrial: Waterproof membranes.
Revenue is diversified across sectors, but heavily tied to global PVC demand and pricing. The business is scalable, yet working capital cycles are stretched like chewing gum.
Financials Overview
| Particulars (₹ Cr) | Q1 FY26 | Q1 FY25 | YoY Change |
|---|---|---|---|
| Revenue | 339 | 320 | +6% |
| EBITDA | 73 | 71 | +3% |
| Net Profit | 50 | 48 | +4% |
| OPM % | 21% | 22% | Slight Dip |
EBITDA margins remain strong at 21%, but top-line growth is sluggish. PAT of ₹50 Cr keeps the bottom line shiny, yet not enough to justify 30x P/E.
Valuation
Let’s audit this baby:
- P/E Method:
- EPS (TTM) ≈ ₹7.5
- Industry P/E ≈ 25x
- FV ≈ 7.5 × 25 = ₹187
- EV/EBITDA Method:
- EV ≈ ₹5,995 Cr (almost debt-free)
- EBITDA ≈ ₹296 Cr
- EV/EBITDA ≈ 20x (Sector avg 15x)
- FV ≈ ₹180–200
- DCF (Quickie):
- FCF ≈ ₹100 Cr, growth 6%, WACC 10%
- FV ≈ ₹190
👉 Fair Value Range: ₹180–200. Current ₹225 = slightly overpriced vinyl flooring.
What’s Cooking – News, Triggers, Drama
- Export Opportunities: Strong demand in Europe & US for synthetic leather.
- Capacity Expansion: Focus on vinyl sheets to drive future revenue.
- Debt-Free Advantage: Low leverage gives room for expansion.
- Risks: High debtor days, volatile PVC prices, weak dividend policy.
Balance Sheet
| ₹ Cr (Mar 2025) | Value |
|---|---|
| Assets | 1,738 |
| Liabilities | 392 |
| Net Worth | 1,346 |
| Borrowings | 256 |
Roast: Assets are growing, but debtors eat cash. Almost like giving free flooring samples to everyone in town.
Cash Flow – Sab Number Game Hai
| ₹ Cr | Mar 2023 | Mar 2024 | Mar 2025 |
|---|---|---|---|
| Operating | 225 | 75 | 75 |
| Investing | -156 | -102 | -102 |
| Financing | -77 | 18 | 18 |
Roast: Operating cash flow collapsed from ₹225 Cr to ₹75 Cr. Profits exist only on paper if customers don’t pay.
Ratios – Sexy or Stressy?
| Metric | Value (FY25) |
|---|---|
| ROE | 16% |
| ROCE | 16% |
| P/E | 30x |
| PAT Margin | 21% |
| D/E | 0.15 |
Verdict: Profitability is sexy, but valuation is giving luxury-brand vibes.
P&L Breakdown – Show Me the Money
| ₹ Cr | Mar 2023 | Mar 2024 | Mar 2025 |
|---|---|---|---|
| Revenue | 974 | 1,087 | 1,418 |
| EBITDA | 110 | 244 | 295 |
| PAT | 24 | 161 | 199 |
Roast: From ₹24 Cr to ₹199 Cr in two years—profit growth is insane, but sustaining it is the challenge.
Peer Comparison
| Company | Revenue (₹ Cr) | PAT (₹ Cr) | P/E |
|---|---|---|---|
| Sheela Foam | 3,439 | 60 | 121x |
| Responsive Ind | 1,437 | 200 | 30x |
| Stanley Lifestyle | 426 | 29 | 65x |
| Interiors & More | 59 | 12 | 30x |
Roast: Responsive is cheaper than Sheela Foam but still not a bargain bin deal.
Miscellaneous – Shareholding, Promoters
- Promoters: 58.6% (solid control)
- FIIs: 31.4% (they like the story)
- DIIs: 3.3%
- Public: 6.7% (retail still sleeping)
No IPO, no mergers, no controversies—boring but safe.
EduInvesting Verdict™
Responsive Industries is like that rich uncle who looks simple but drives a Porsche. Profits have grown like crazy (54% CAGR over 5 years), margins are stable, and debt is manageable. However, cash flow issues and high debtor days mean profits are more on paper than in the bank.
SWOT Analysis
- Strengths: Strong product portfolio, export potential, solid margins.
- Weaknesses: High debtor days, weak cash flows.
- Opportunities: Global vinyl demand, new capacity utilization.
- Threats: PVC price swings, competition from low-cost players.
Final Word: At ₹225, the stock is pricing in perfection. Unless debtor management improves, this vinyl might lose shine. Long-term investors can hold; new entrants should wait for better entry.
Written by EduInvesting Team | 30 July 2025SEO Tags: Responsive Industries Ltd, PVC Products, Synthetic Leather, Q1 FY26 Results


: Investors Strap In for a Bumpy, Billion-Euro Ride")


