Remsons Industries Q4 FY26: Revenue Races, But Margins Play Hide-and-Seek
Spotted a factual error — a wrong number, date, or fact? Tell us and we will check the source.
General information and entertainment, not investment advice. The author is not a SEBI-registered adviser or research analyst. No recommendation, no promised returns. Markets carry risk including loss of capital. Figures may not be current. Consult a registered adviser before acting.
1. At a Glance
Remsons delivered ₹130 crore in Q4 FY26—up 23% YoY but down 6% quarter-on-quarter. Revenue for the full year hit ₹469 crore, a 24% jump from ₹377 crore in FY25. The story is built on solid top-line momentum, but the margin arc tells a less linear tale: Q4 operating profit dipped to ₹11 crore (8.4% OPM) from Q3’s ₹14.7 crore (12% OPM), signaling either a seasonal trough or temporary execution hiccup.
Net profit clocked ₹5.2 crore in Q4—down from ₹5.1 crore in Q3—while the full year brought home ₹18 crore (4.3% PAT margin), up 26% from ₹14.4 crore in FY25. The company sits on ₹24 crore net cash and a debt-to-equity ratio of 0.63x, both healthy anchors. Yet there is tension: rapid growth in a cyclical business competing for OEM orders in a sector under EV-driven margin pressure.
Wisdom line: Scale without margin discipline is just burning fuel at a higher temperature.
2. Introduction
Remsons has been threading the automotive components needle since 1971—starting with control cables, spiraling into a portfolio spanning mechanical systems, sensors, lighting, and now railways and defense. The company went public in 1995, and for most of its life occupied a thin slice of the market: the reliable cable guy. But since 2020, the narrative has shifted: acquisitions (Magal Cables UK in 2020, BEE Lighting in 2024), joint ventures (Aircom for tire kits, Uni Automation for sensors), and internal buildouts (a new 30,000 sq ft facility in Chakan for rail components) paint a deliberate journey toward “Remsons 2.0″—a systems provider, not a component trader.
FY26 was the year those moves began translating into numbers. Revenue grew 24%, profit grew 26%, and the company signed ink on a ₹300 crore Stellantis order (North America, 7 years, control cables), a ₹60 crore CV OEM deal for gear shifters, and secured slots in lighting and sensors for global players. The CEO, Amit Srivastava (who joined to drive this shift), announced his resignation on 18 June 2026, leaving a 90-day notice period—a reminder that execution risk often wears a face.
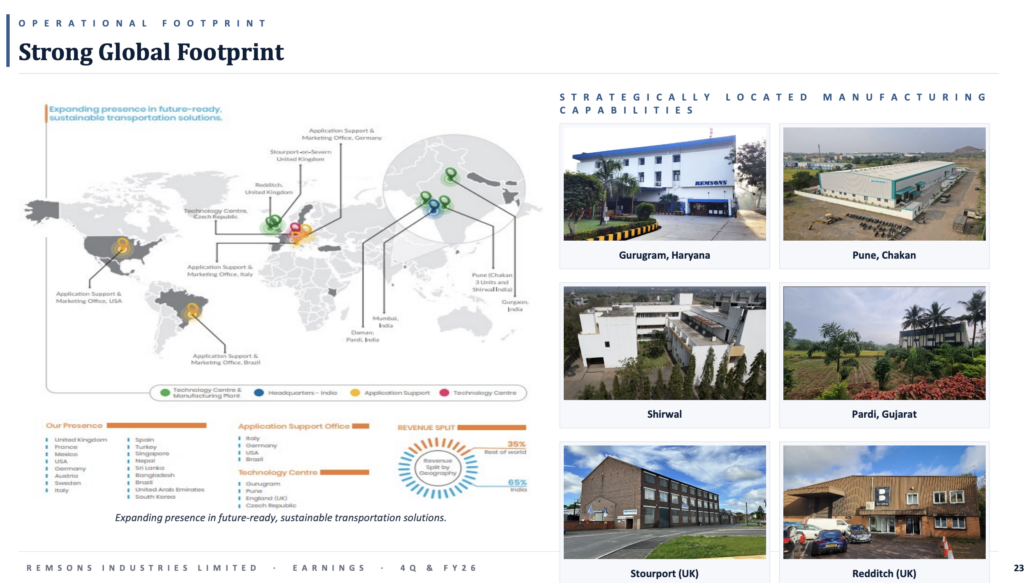
Domestically, exports now represent 33% of Q4 sales, up from a historical base of 20–25%. The business remains 62% India, 38% Rest of World for the full year, but the global threads are thickening.
3. Business Model: WTF Do They Even Do?
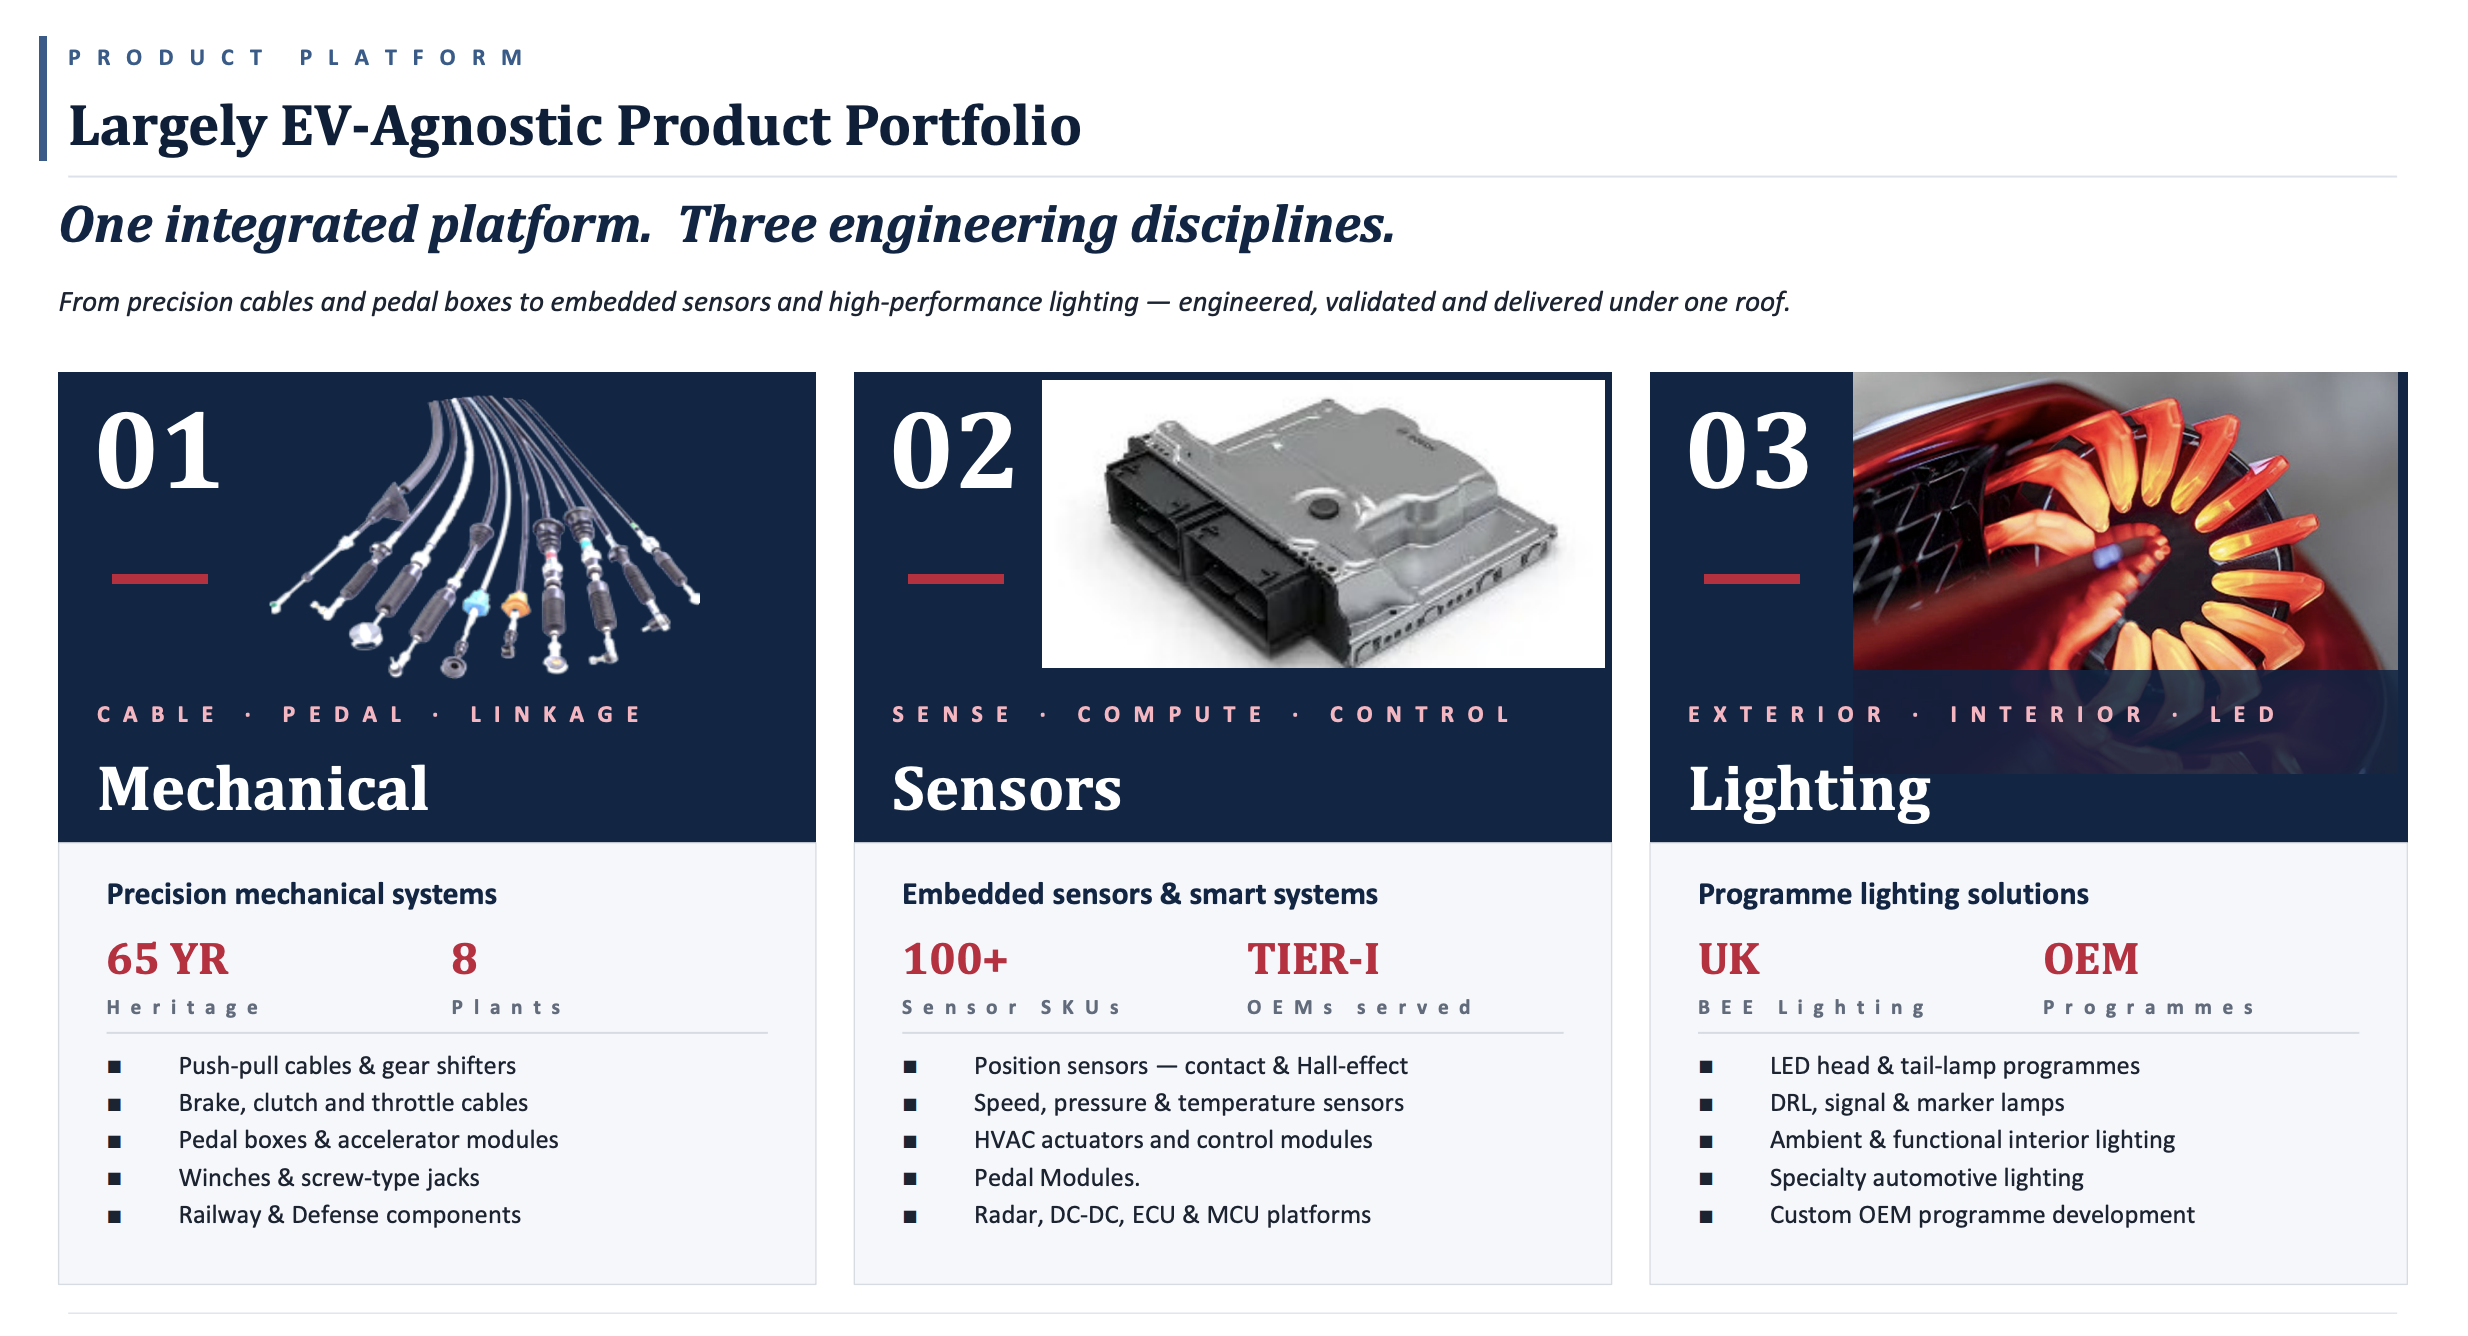
Remsons manufactures three flavors of automobile-adjacent hardware: mechanical systems (cables, shifters, pedal boxes, winches, brake mechanisms), sensors (throttle position, speed, temperature, Hall-effect), and lighting (LED heads/tails, ambient interior, DRL—all mostly from the acquired BEE Lighting arm in the UK).
The mechanical core—cables and shifters—still dominates revenue (~65% of the mix), with 600 million parts fitted across two-wheelers (34% of revenue), passenger cars (42%), commercial vehicles (19%), and off-highway segments (4%). OEM supply is 92% of revenue; aftermarket accounts for 8%. The company counts 20+ Tier-1 OEMs as customers: Maruti, Hero, Tata, Ashok Leyland, Mahindra in India; Ford, Jaguar, Volvo, Daimler, PSA globally.
The acquired pieces add color. BEE Lighting serves supercar makers (Aston Martin, Lamborghini, Jaguar) and premium OEMs—high-margin, low-volume businesses. Uni Automation (sensors) is an in-house backward integration play, enabling design and validation without outsourcing. The new rail facility (Chakan) targets freight and passenger locomotives—a virgin market for Remsons, with products under RDSO (Railway Board) audit, expected to contribute ₹25–35 crore in FY26 and scale to ₹150 crore over three years per management guidance.
Defense and tire mobility kits are opening wedges, not revenue anchors yet.
The economics hinge on OEM stickiness (long contracts = visibility) and the ability to move up the value chain (systems sell higher margins than parts). But the model is capital-intensive (capex for FY26 was ₹15–19 crore incurred, with ₹5–7 crore more to come, and FY27 guidance is ₹20+ crore), and working capital remains a drag—receivables at 76 days and inventory at 114 days soak up cash despite management’s target of 60 days.
4. Financials Overview
Quarterly Results (Consolidated, ₹ Cr)
Metric
Q4 FY26
QoQ Change
Q4 FY25
YoY Change
Revenue
130.4
-6%
106.2
+23%
Operating Profit
11.0
-25%
11.0
+0%
PAT
5.2
+2%
5.2
+4%
EPS (₹)
1.50
+2%
1.31
+15%
Full Year Results (Consolidated, ₹ Cr)
Metric
FY26
FY25
Change
Revenue
468.7
376.6
+24%
Operating Profit
50.0
37.4
+33%
PAT
18.1
14.4
+26%
EPS (₹)
5.18
4.12
+26%
Figures are consolidated. All financials in ₹ crore unless stated otherwise. Full-year EPS calculated from net profit divided by 3.49 crore shares (adjusted for bonus).
The headline: FY26 marked a pivot year. Revenue growth of 24% (CAGR from FY19–FY26: 17%) was driven equally by organic top-line expansion and a full year of Magal Cables (UK) contribution post-acquisition. Operating profit swelled 33% YoY, suggesting either operational leverage or one-time tailwinds (the Stellantis order ramp hasn’t materialized in full yet—FY27 guidance pins ₹40–50 crore annual run-rate to come in 2H FY27).
Q4 presents a caution flag: OPM fell to 8.4% from 12% in Q3 and 10% in Q2. Management attributed this to a mix of seasonal factors (Q4 historically sees some destocking) and the timing of new order ramps (Stellantis ramping Q2 onwards, CV OEM ramping Q1 FY27). Operating leverage is real but uneven quarter-to-quarter.
5. Market Expectations & Historical Multiples
This section describes how the market is currently pricing the company and how that compares with its own history and peer group. It is descriptive, not predictive.
Valuation Metrics
Metric
Current
FY26 Avg
5-Year Avg
Peer Median (Auto Ancillary)
P/E
16.5
16.5
15.2
27.9
EV/EBITDA
6.8
6.8
8.1
N/A
P/B
2.0
2.0
2.3
2.0
ROE
13.5%
13.5%
14.8%
13-16% (median)
ROCE
15.5%
15.5%
14.2%
15.9%
The market currently pays 16.5x trailing earnings for Remsons, significantly below the peer median of 27.9x for auto components firms. This discount reflects both Remsons’ lower absolute scale (₹300 Cr market cap vs peers in ₹5,000–₹100,000 Cr range) and the market’s caution on execution risk during the “2.0” transition (acquisitions, new verticals, CEO exit).
Return metrics are respectable: ROE of 13.5% sits near peer averages, and ROCE of 15.5% mirrors the broader group. However, the company’s 5-year ROE average (14.8%) is being compressed by the FY21–FY23 period (ROE was 12–17%), when leverage was higher and integration costs from Magal weighed on returns. FY26 benefited from debt reduction and higher profitability, but the trajectory is gradual, not explosive.
The P/B multiple of 2.0x is aligned with peer norms, suggesting book value is not a distressed asset or a hidden gem—just in line with what a steady auto component supplier should command.