General information and entertainment, not investment advice. The author is not a SEBI-registered adviser or research analyst. No recommendation, no promised returns. Markets carry risk including loss of capital. Figures may not be current. Consult a registered adviser before acting.
1. At a Glance
Ramdevbaba Solvent refines rice bran oil in Nagpur and sells it to names like Marico and Mother Dairy. In FY26 it booked ₹823 crore of sales — down from ₹929 crore the year before — and ₹11.4 crore of net profit, down from ₹15 crore. On a ₹823 crore top line, the operating profit was ₹26 crore. That is a 3% operating margin, which is what happens when you buy rice bran, press oil out of it, and sell the oil in a market where everyone else also owns a press.
The attention-grabber sits on the balance sheet, not the income statement. Borrowings climbed to ₹359 crore against a net worth of ₹163 crore. Capital work-in-progress stands at ₹191 crore — larger than the entire net block of actual operating assets. Operating cash flow was negative ₹56 crore for the year.
So the record shows a thin-margin commodity refiner mid-way through a large, half-built expansion, funded by debt and equity rather than its own cash. The market pays 15.6x earnings for this — below the peer median of 19.8x.
Everything interesting here is about what isn’t finished yet.
2. Introduction
Founded in 2008, Ramdevbaba Solvent physically refines rice bran oil and sells it two ways: as a third-party manufacturer to FMCG majors, and under its own “Tulsi” and “Sehat” brands through thirty-eight distributors across Maharashtra. The by-product of the extraction — de-oiled rice bran, or DORB — goes out as animal feed across nine states. Fatty acid, lecithin, gum and wax get sold on the open market. Very little is wasted; the whole model is built on squeezing value out of what’s left after the oil comes out.
The company listed on the NSE SME platform in April 2024, raising net proceeds of ₹44.6 crore, fully deployed toward a new manufacturing facility, borrowing repayment, and working capital. A February 2025 preferential issue raised a further ₹26 crore of equity and warrants at ₹139 each, of which the ₹7.9 crore warrant balance is still owed by the promoter holders.
The recent chapter is about a subsidiary. Through 2025 and 2026, RBS Renewables — a grain-based ethanol venture — moved from associate to subsidiary to majority-owned, with the company lifting its stake to 64.82% in June 2026. That entity dispatched its first ethanol to oil-marketing companies in April 2026. This is the story the ₹191 crore of work-in-progress is quietly telling.
3. Business Model: WTF Do They Even Do?
Rice bran is what’s left when rice is milled — a papery, oily husk that most people would call waste. Ramdevbaba’s entire existence is the argument that it isn’t. They run it through solvent extraction (255,000 MTPA installed) and physical refining (48,000 MTPA), pull out edible oil, and sell the exhausted bran as feed.
The revenue mix is honest about what this really is. Rice bran oil under the company’s own brands is roughly 11.5% of revenue. Oil sold to other brands is 31%. DORB — the animal-feed by-product — is 37.5%, the single biggest slice. Which means the largest revenue line isn’t the premium consumer oil with a brand name; it’s the leftover bran sold as poultry and fish feed. This is a business where the by-product is the main product.
The margins follow from that. When more than a third of your revenue is commodity feed and another third is unbranded oil sold to companies with their own shelves, you are a price-taker wearing a manufacturer’s coat. The 3% operating margin isn’t a failure of execution — it’s the arithmetic of selling inputs to people who own the brands.
The new frontier is corn de-oiling and ethanol. The company is building a corn dry-milling facility whose output feeds RBS Renewables’ ethanol plant. That is the pivot the balance sheet is financing — from a low-margin oil presser into a grain-based ethanol supplier to government oil companies. Whether that changes the margin story is the open question the whole entry keeps circling.
4. Financials Overview
Figures are consolidated, in ₹ crore.
| Metric | Latest Half (Mar 2026) | YoY (Mar 2025) | Prev Half (Sep 2025) |
|---|---|---|---|
| Sales | 438 | 527 | 386 |
| Operating Profit | 12 | 12 | 14 |
| PAT | 5 | 7 | 6 |
| EPS (₹) | 2.10 | 3.04 | 2.90 |
The half-year top line fell about 17% against the same half a year earlier, while operating profit held flat at ₹12 crore. Profit after tax came in at ₹5 crore for the half against ₹7 crore a year before. Sales rose versus the immediately preceding half, but profit didn’t follow it up.

The audited results carry a specific note worth recording: the half-year figures for March 2026 were derived as a balancing figure between the full audited year and the audited September half — standard practice under Schedule III, stated plainly in the filing.
Does a flat operating profit on a falling top line describe cost discipline, or a business where the numbers simply don’t move much either way?
5. Market Expectations & Historical Multiples
This section describes how the market is currently pricing the company and how that compares with its own history and peer group. It is descriptive, not predictive.
| Metric | Current | Historical Average | Peer Median |
|---|---|---|---|
| P/E | 15.6 | — | 19.8 |
| P/B | 1.09 | — | — |
| EV/EBITDA | 17.1 | — | — |
| ROE | 7.3% | 15.1% (5-yr) | 12.3% |
| ROCE | 5.4% | 17–20% (FY22–23) | 12.3% |
The market currently pays 15.6x earnings here, below the peer median of 19.8x and the industry 19.4x. Return on equity of 7.3% sits well under the company’s own five-year average of 15.1% and under the peer median. ROCE of 5.4% is roughly a third of the 17–20% the company posted in FY22 and FY23, before the capex cycle enlarged the capital base without yet enlarging the returns on it.
What the market appears to be pricing, reading the figures on the page, is a company whose invested capital has expanded faster than its earnings — ₹191 crore of work-in-progress that currently earns nothing, a ROCE dragged down while that asset sits half-built, and an ethanol subsidiary that has only just begun dispatching. The multiple below its peers describes a market weighing a completed refiner against one mid-transition.
The factual observation on expectations: the returns ratios reflect the base before the new capacity contributes, not after.
6. What’s Cooking
Four real events sit in the filings, and they’re all about the same subsidiary.
In June 2026, the board approved buying an additional 14% of RBS Renewables for ₹3.64 crore in cash, lifting the holding from 50.82% to 64.82%. The disclosure notes RBS Renewables had a turnover of ₹1.97 crore for FY26 — so the company paid ₹3.64 crore to raise its stake in an entity that did under ₹2 crore of business last year. The acquisition falls within related-party transactions, since the Managing Director is also a director of the target and part of the promoter group; the filing states it was cleared by the Audit Committee at arm’s length.
In April 2026, RBS Renewables made its first ethanol dispatch to oil-marketing companies. In October 2025, the subsidiary was awarded a 24,063 KL ethanol allocation, with a first order of 1,386 KL worth about ₹9.64 crore. And in November 2025, a fire broke out at the Bramhapuri subsidiary site — no injuries, plant halted, insurance notified, loss yet to be ascertained.
7. Balance Sheet
| Item | Mar 2022 | Mar 2024 | Mar 2026 |
|---|---|---|---|
| Total Assets | 131 | 329 | 598 |
| Net Worth | 35 | 73 | 163 |
| Borrowings | 65 | 192 | 359 |
| Other Liabilities | 32 | 64 | 77 |
| Total Liabilities | 131 | 329 | 598 |
Assets equal liabilities in each column. The story is in the pace: total assets more than quadrupled in four years, and borrowings did roughly the same, from ₹65 crore to ₹359 crore.
- Borrowings of ₹359 crore against net worth of ₹163 crore put debt at more than twice equity — the balance sheet leans on lenders about as hard as on owners.
- Capital work-in-progress of ₹191 crore exceeds the net block of ₹125 crore in operating assets; more is being built than is currently running.
- Cash and bank stood at ₹1.2 crore at year-end — against ₹359 crore of borrowings, the liquidity cushion is thin enough to see through.
A balance sheet that grows this fast is either a company building its future or a company outrunning its cash — and here the two descriptions point at the same ₹191 crore.
Net debt sits near ₹357 crore, borrowings less cash.
8. Cash Flow: Sab Number Game Hai
Consolidated, in ₹ crore.
| Year | Operating | Investing | Financing |
|---|---|---|---|
| Mar 2024 | -23 | -83 | +113 |
| Mar 2025 | -1 | -128 | +125 |
| Mar 2026 | -56 | -30 | +82 |
Three straight years of negative operating cash flow, deepening to negative ₹56 crore in FY26. Every year, financing inflows — debt and equity — filled the gap and funded the investing outflows. The company’s operations have not self-funded the build; external capital has. That is a normal shape for a business mid-expansion, and it is also the exact shape that requires the expansion to eventually work.
When operations consume cash three years running, the timeline to finished capacity stops being a strategy slide and starts being a countdown.
9. Ratios: Sexy or Stressy?
| Ratio | Value |
|---|---|
| ROE | 7.3% |
| ROCE | 5.4% |
| P/E | 15.6 |
| PAT Margin | 1.4% |
| D/E | 2.20 |
ROE of 7.3% means the equity is working part-time relative to the 15% it managed on average over five years. ROCE of 5.4% shows capital earning less than half what it did before the base ballooned. PAT margin of 1.4% is the commodity-refiner reality — ₹11.4 crore of profit sits on ₹823 crore of sales. Debt-to-equity of 2.20 restates the balance-sheet point as a single number. The inventory days moved to 73 from 36, and the cash conversion cycle to 70 days from 34 — working capital is absorbing more, not less.
10. P&L Breakdown: Show Me the Money
Consolidated, in ₹ crore.
| Year | Revenue | Operating Profit | Other Income | PAT | EPS (₹) |
|---|---|---|---|---|---|
| Mar 2024 | 686 | 25 | 7 | 13 | 8.04 |
| Mar 2025 | 929 | 26 | 7 | 15 | 6.56 |
| Mar 2026 | 823 | 26 | 6 | 11 | 5.00 |
Operating profit has been flat at ₹25–26 crore for three years while revenue swung from ₹686 crore up to ₹929 crore and back to ₹823 crore. The oil business, in other words, produces roughly the same absolute profit regardless of how much revenue passes through it — a hallmark of the price-taker.
Other income of ₹6–7 crore each year runs at a meaningful fraction of net profit; against ₹11–15 crore of PAT, non-operating income is carrying more of the bottom line than a refiner would want to admit.
The EPS guard matters here. Between FY24 and FY25, PAT rose from ₹13 crore to ₹15 crore, yet EPS fell from ₹8.04 to ₹6.56. That is not a profit decline — it’s the share count rising from 1.62 crore to 2.29 crore shares after the IPO and preferential issue. The per-share figure dropped because the pie was cut into more slices, not because the pie shrank. FY26’s EPS of ₹5.00 does reflect a genuinely lower profit on a steady count.
11. Peer Comparison
| Company | Revenue (Qtr, ₹cr) | PAT (Qtr, ₹cr) | P/E |
|---|---|---|---|
| Marico | 3,333 | 408 | 62.5 |
| Patanjali Foods | 11,156 | 524 | 22.4 |
| AWL Agri | 21,465 | 293 | 22.8 |
| Gokul Agro | 6,200 | 119 | 16.6 |
| CIAN Agro | 656 | 64 | 18.4 |
| Sundrop Brands | 387 | 10 | 120.2 |
| Shri Venkatesh | 822 | 24 | 19.8 |
| Ramdevbaba Sol. | 438 | 5 | 15.6 |
Ramdevbaba carries the lowest P/E in the set at 15.6x and one of the smallest quarterly profit figures at ₹5 crore. Its ROCE of 5.4% sits below the peer median of 12.3%. The comparison describes a company priced at a discount to peers while also earning a lower return on capital than they do — the multiple and the return point the same direction.
12. Miscellaneous: Shareholding & Promoters
| Holder | % (Mar 2026) |
|---|---|
| Promoters | 62.6% |
| Institutions | 0.8% |
| Public | 36.6% |
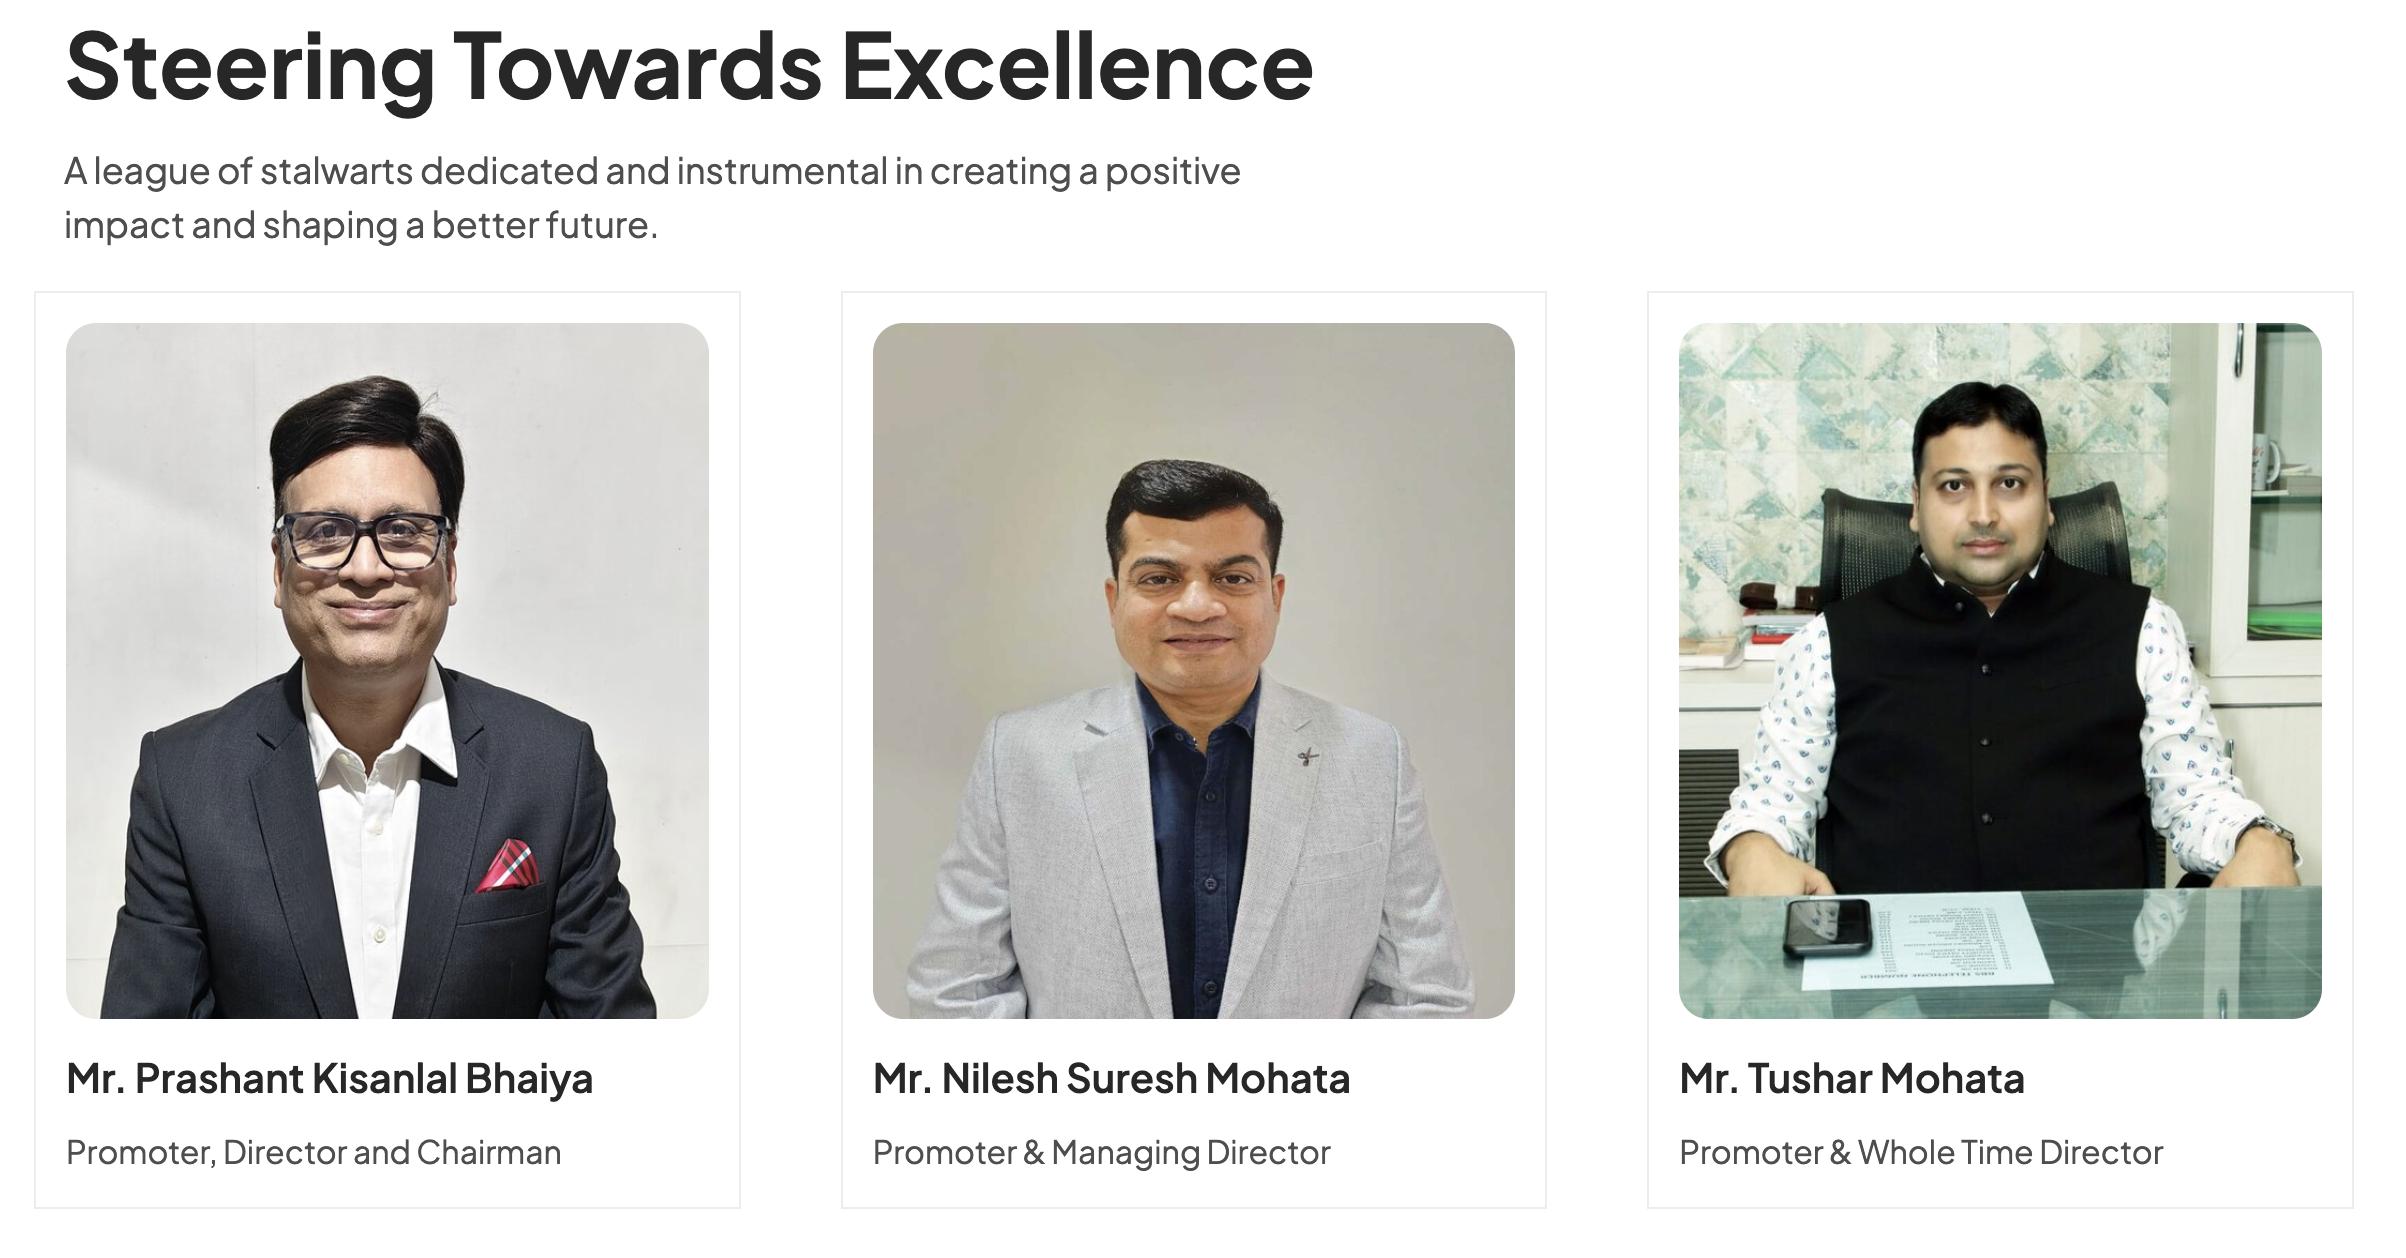
Promoter holding rose slightly to 62.6%, with no shares pledged. The Mohata and Bhaiya families dominate the register — Tushar Mohata (17.7%) and Nilesh Mohata (16.2%) the largest individual holders. Institutional presence is negligible: FIIs went from 5.1% to zero over two years, and DIIs from 5.3% to 0.8%. The professional money that was here at listing has largely left the register.
Nilesh Suresh Mohata serves as Managing Director and is also a director of the RBS Renewables entity the company keeps acquiring — a related-party overlap the filings disclose openly rather than bury.
13. Corporate Governance: Angels or Devils?
The record here is more disclosed than dramatic. The FY26 accounts carry an unmodified (clean) audit opinion from Borkar & Muzumdar. The company appointed a cost auditor and an internal auditor for FY27, both routine. Promoter groups filed their FY26 encumbrance declarations confirming no new pledges.
Two items belong on the record as facts. The audit report’s Key Audit Matters flag income-tax litigations across various financial years and the November 2025 fire, the loss from which was yet to be ascertained at reporting. Separately, the AGM sought approval for related-party transactions of up to ₹350 crore — a large ceiling for a company this size, and a natural consequence of a structure where the parent keeps transacting with a subsidiary its Managing Director also directs. All disclosed; all on the table.
14. Industry Roast & Macro Context
Edible oil refining is one of the least forgiving corners of Indian FMCG: the input is a globally-priced commodity, the output competes on price, and the branded players — Marico, Patanjali, AWL — sit on distribution moats a Nagpur refiner can’t dig. The peer table tells it plainly: Marico earns a 47% ROCE and trades at 62x; the commodity refiners cluster at 16–23x with single-to-mid-teen returns. The margin ceiling in this business is set by whoever owns the shelf, and the shelf is spoken for.
The interesting macro pull is ethanol. India’s blending programme has turned grain-based ethanol into a policy-backed demand source, which is precisely why the company is building corn de-oiling capacity and feeding a subsidiary that now dispatches to oil-marketing companies. The sector’s low-margin trap and its one genuine escape hatch happen to sit in the same company.
15. EduInvesting Verdict
| Strengths | Weaknesses |
|---|---|
| Clean audit opinion, zero pledge, established FMCG client base | 3% operating margin, 1.4% net margin — commodity economics |
| Ethanol pivot with policy tailwind and first dispatches done | D/E of 2.2, ₹359 Cr borrowings, three years negative operating cash |
| Opportunities | Threats |
| ₹191 Cr capex converting to ethanol revenue | Fire loss unascertained; income-tax litigations open |
| Grain-based ethanol demand from blending programme | Working capital cycle stretched to 70 days; institutions have exited |
Ramdevbaba Solvent’s FY26 record is a study in timing: a low-margin oil refiner has borrowed and issued its way into a half-built ethanol future, with the returns ratios reflecting the cost of the transition and none of its payoff yet. The ₹191 crore of work-in-progress is the whole thesis and the whole risk, sitting in the same line item.
A refiner earning 3% margins, mid-leap toward a business it hasn’t finished building — the balance sheet has already spent the money the income statement hasn’t yet seen.