Rainbow Foundations FY26: ₹167 Cr of Flats Sold, ₹37 Cr Handed to Lenders, ₹7 Cr Left Over
Spotted a factual error — a wrong number, date, or fact? Tell us and we will check the source.
General information and entertainment, not investment advice. The author is not a SEBI-registered adviser or research analyst. No recommendation, no promised returns. Markets carry risk including loss of capital. Figures may not be current. Consult a registered adviser before acting.
1. At a Glance
Rainbow Foundations closed FY26 with revenue of ₹166.75 crore, up from ₹156.13 crore a year earlier — a Chennai real-estate outfit that has quietly quadrupled sales in three years. Operating profit landed at roughly ₹48 crore, a 28% margin. So far, a growth story.
Then the interest line arrives. Finance costs of ₹37.2 crore in FY26 sat against that ₹48 crore of operating profit, and profit before tax actually fell to ₹10.18 crore from ₹11.03 crore. Net profit slipped to ₹7.12 crore from ₹8.01 crore. Revenue climbed; the bottom line reversed. The entire gap between “good year” and “flat year” is the lender’s cut.
Underneath sits a balance sheet carrying ₹480.52 crore of borrowings against ₹87.33 crore of net worth — a debt-to-equity of 5.5 — and inventory of ₹747.16 crore. Interest coverage stands at 1.29. The market currently pays about 28x earnings for the whole ₹197 crore enterprise.
A company that sells more every year and keeps less. The record for the year is below.
2. Introduction
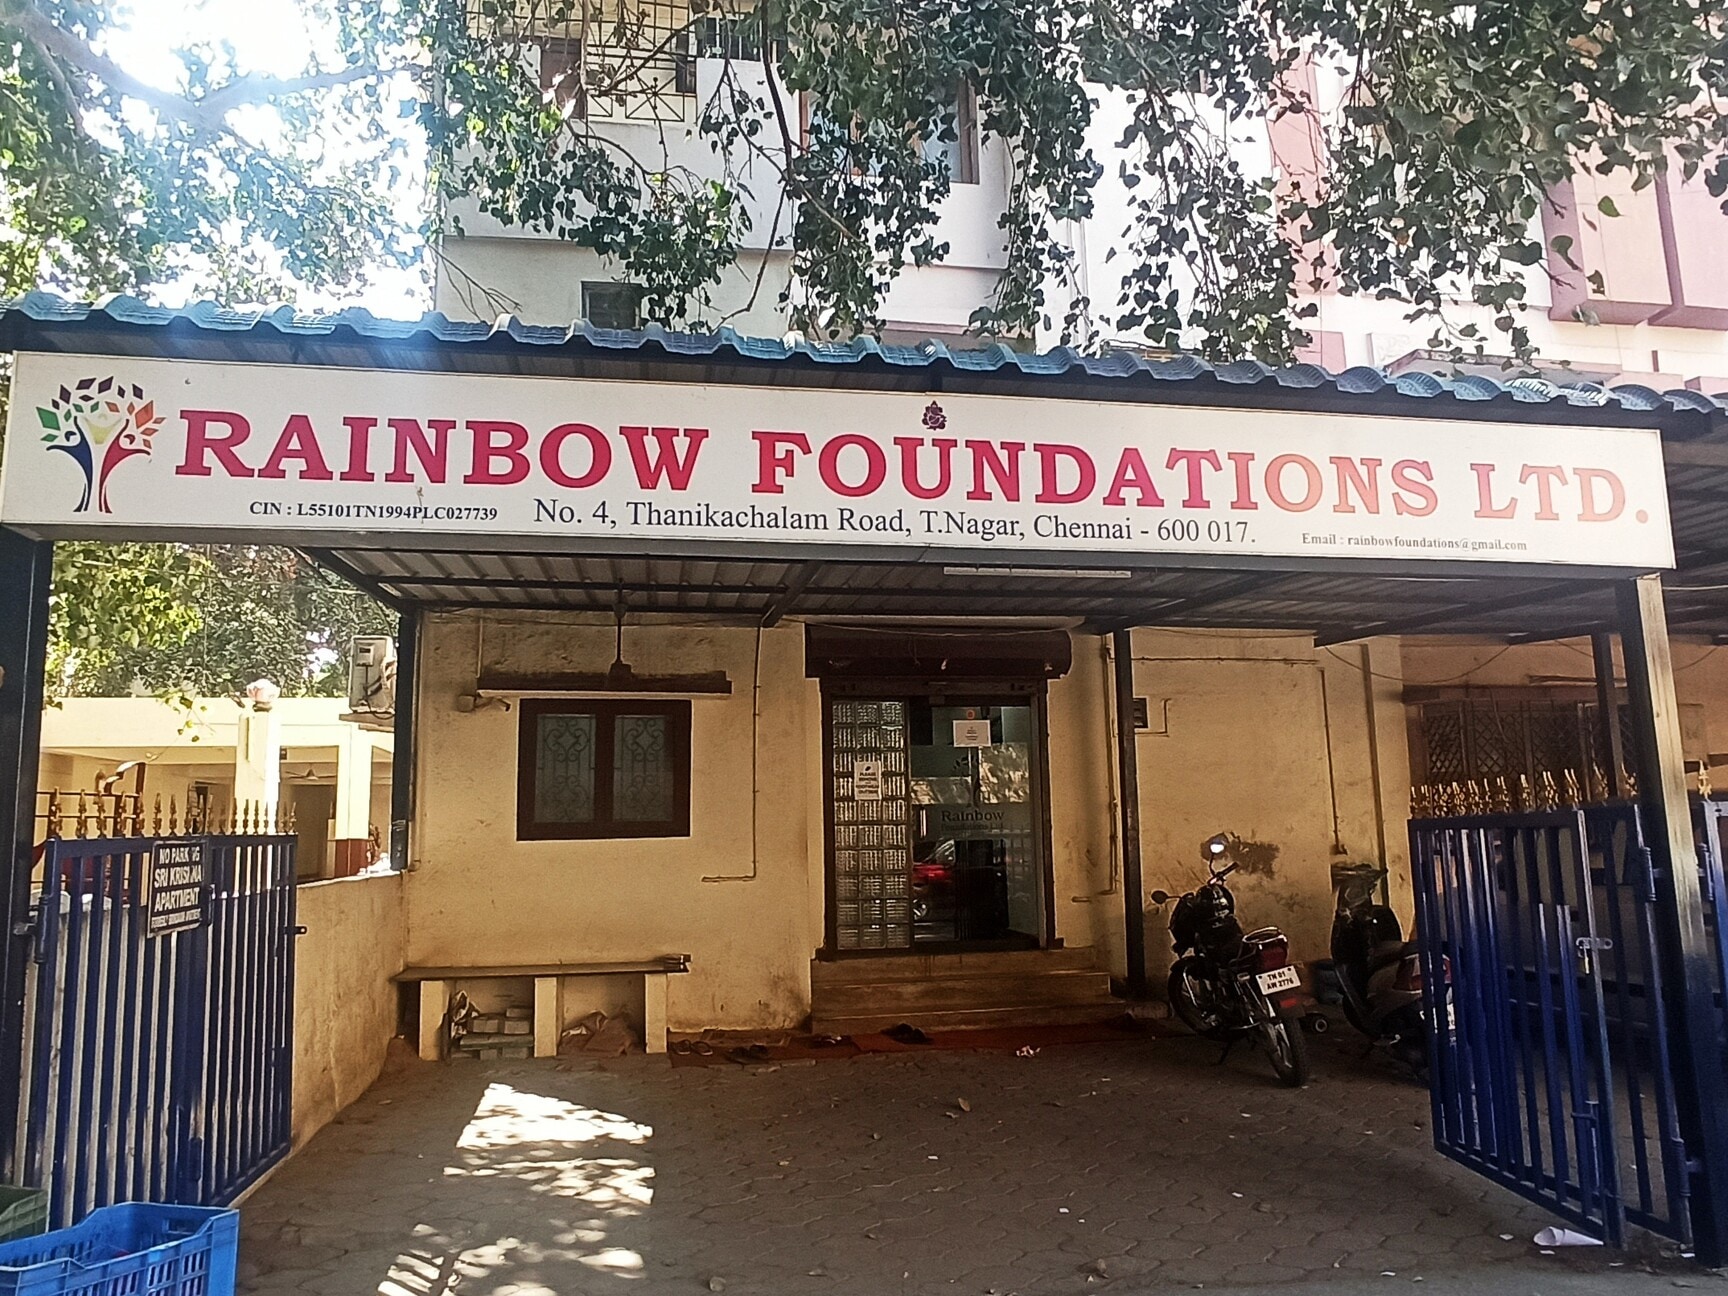
Incorporated in 1994 and listed on the BSE, Rainbow Foundations Limited builds flats, commercial complexes and resorts, and develops and markets plots of land, operating out of T. Nagar, Chennai. It also describes an Engineering, Procurement and Construction line covering design, materials supply, installation and project management.
The capital history is busy for a company this size. Share capital was expanded in FY21, and in FY22 the company ran a rights issue of 4.41 crore equity shares at ₹11 each in an 8-for-1 ratio — which is why the share count jumped from 55 lakh to 4.96 crore and has stayed there since. Preference shares were allotted earlier still.
The most recent year brought audited FY26 results approved on 30 May 2026 with an unmodified auditor opinion, board changes in September 2025, and a ₹50 crore corporate guarantee extended to a subsidiary. Each is dealt with in its own section below.
3. Business Model: WTF Do They Even Do?
They buy land, sit on it while it becomes inventory, build on it, and sell flats and plots — with the twist that the sitting-on-it phase is where most of the money lives. Inventory on the FY26 balance sheet is ₹747.16 crore. Annual revenue is ₹166.75 crore. The company is carrying more than four years of sales as unsold or under-construction stock, which is less a warehouse than a way of life.
The revenue itself is real construction: cost of construction and project materials ran ₹109.66 crore in FY26, the largest line by far. Historically the split has leaned toward flats, houses and shops, with plots and land making up the rest — the mix has swung around from year to year rather than settling. Employee cost is a rounding error at ₹2.11 crore; this is a business of land and concrete, not headcount, and the permanent-employee count has bounced between 10 and 20 over the years.
The model’s tension is structural, not incidental. Real estate development ties up cash for years before recognising revenue, and Rainbow funds that gap with borrowing. So the operating engine works — 28% margins prove it — but the financing engine runs hot enough to eat most of what the operating engine makes. Does a business that must borrow ₹480 crore to hold ₹747 crore of inventory own its projects, or merely rent them from its lenders?
4. Financials Overview
Figures are consolidated, in ₹ crore. The consolidated results equal the standalone: the lone subsidiary has not commenced operations and carries nil across the board.
Metric (Q4 FY26)
Latest Q
YoY
QoQ
Revenue
43.26
+31.3%
+12.7%
Operating Profit
16.02
+87.8%
+48.2%
PAT
3.91
+29.0%
+435.6%
EPS (₹)
0.79
+29.5%
+426.7%
The March quarter was the strongest of the year, with a 37% operating margin against the low-20s to high-20s in prior quarters — the figures sit on the results statement. The QoQ