General information and entertainment, not investment advice. The author is not a SEBI-registered adviser or research analyst. No recommendation, no promised returns. Markets carry risk including loss of capital. Figures may not be current. Consult a registered adviser before acting.
1. At a Glance
FY26 revenue stood at ₹3,168 Cr, down 1.9% YoY from ₹3,228 Cr in FY25—the headline is deceptive. The real story lives in the P&L. EBITDA contracted 51.7% to ₹1,518 Cr; operating margins collapsed from 9.7% to 4.8%. But the number that wakes you up: net profit cratered 89.1% to ₹238 Cr from ₹2,189 Cr a year prior.
How a company holds ₹612 Cr in cash and ₹173 Cr of net borrowings while bleeding profitability like this is the tension that matters.
Order book stands at ₹43,050 Cr (Q4-FY26), which sounds reassuring—1.4x annual revenue—until you ask what condition execution is in. The company claims “worst is over on margins.” The market disagrees.
2. Introduction
Praj Industries, founded in 1983 under Dr. Pramod Chaudhari, is a global biotechnology and engineering firm with over 1,000 customer references across 100+ countries and five continents. It dominates a single sector nobody talks about much: the engineering, manufacturing, and commissioning of ethanol plants—and increasingly, the adjacent hardware that turns biomass into fuel.
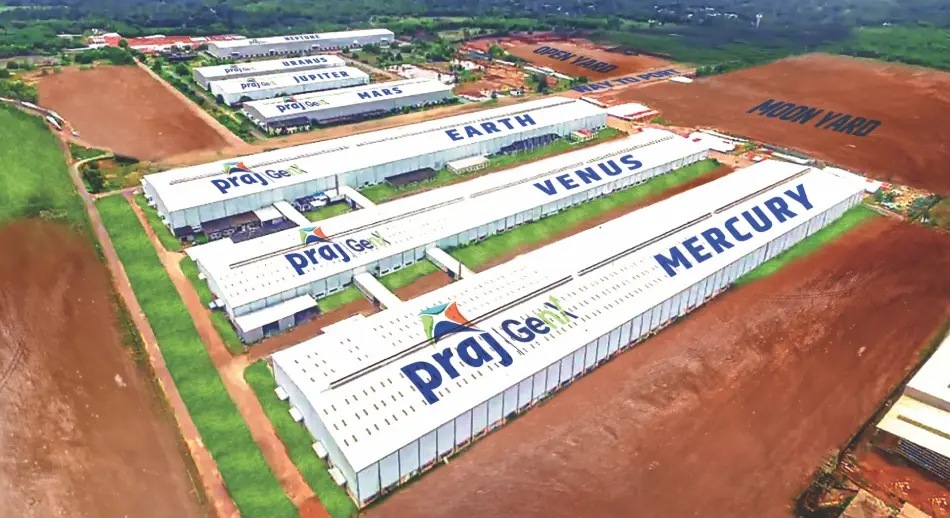
The company has five manufacturing facilities in India and global offices in Thailand, Philippines, and Houston. Its workforce includes 90+ research scientists and 400+ patent filings. Crisil rates it AA/Stable—a mark that screams “solid balance sheet,” which is true, but says nothing about order execution, site costs, or the weather patterns of commodity ethanol markets.
The FY26 earnings call (May 29, 2026) was management’s moment to explain why a company sitting on ₹612 Cr cash, with a AA-rated balance sheet, posted a 89% PAT collapse. They blamed project execution delays, site cost escalation, and a slowdown in 1G domestic ethanol orders. Also, the new Mangalore plant (Praj GenX) started burning fixed costs in FY26 with minimal revenue—a nascent-stage facility working at zero capacity.
Three key promoters hold 32.81% combined: Pramod Madhukar Chaudhari 24.97%, Parimal Pramod Chaudhari 7.83%. FII ownership sits at 17.74%; DIIs at 12.68%.
3. Business Model: WTF Do They Even Do?
The company is three businesses:
Bioenergy (67% of FY26 revenue, ₹21,423 Cr of ₹31,679 Cr consolidated): 1G and 2G ethanol plants; compressed biogas systems; future fuels including Sustainable Aviation Fuel (SAF), marine biofuel, and bio-hydrogen. The 1G domestic business is drowning in a self-created problem: India achieved EBP-20 (20% ethanol blending), and greenfield plants have slowed to a crawl. The company is now chasing brownfield upgrades, DCO (distillers corn oil) modules, and ENA (extra neutral alcohol) plants. This is cheaper, faster—and lower margin.
High Purity Systems (11% of FY26 revenue, ₹3,326 Cr): subsidiary Praj HiPurity Systems supplies turnkey solutions for the biopharma, sterile formulations, topical, oral formulations, personal care, and nutraceutical industries. FY26 revenue ₹3,326 Cr, up 7% YoY. It’s the business that isn’t leaking.
Engineering (22% of FY26 revenue, ₹6,936 Cr): water/wastewater treatment; critical process equipment (reactors, heat exchangers, pressure vessels) for oil & gas, petrochemical, fertiliser; brewery plants. Also houses Praj GenX, a new 100% subsidiary started March 2024 at Mangalore—125 acres, designed for hydrogen, ammonia, carbon capture, and waste-to-energy equipment. GenX lost money in FY26 (CapEx and fixed overhead burn without revenue), but management expects it to “reach break-even in FY27.”
Geography: FY26 revenue was 76.5% domestic, 23.5% international. Order book is 66% domestic, 34% export.
4. Financials Overview
Figures are consolidated, in ₹ crore.
Metric
FY26
FY25
YoY
Revenue
31,679
32,280
(1.9)%
EBITDA
1,518
3,145
(51.7)%
PAT
238
2,189
(89.1)%
EPS (Diluted)
1.30
11.91
(89.1)%
The collapse started mid-FY25. Q4-FY26 (Jan–Mar 2026) net profit was ₹12 Cr on ₹845 Cr revenue, a 1.4% net margin. The preceding quarter (Q3-FY26) posted a loss of ₹12 Cr. This is not a one-quarter blip.
What happened? Management on the May 29 call attributed it to three forces:
Execution delays on fuel ethanol projects: sites staying open longer than planned, indirect costs (labor, temporary structures, logistics) mounting. CFO said raw material inflation was not the culprit (“prices more or less remained same”); the cost escalation came from time—projects running longer than budgeted.
Transition from Greenfield to Brownfield: Greenfield ethanol plants are fixed-price contracts under project risk. Brownfield upgrades are shorter-cycle, lower-margin work. The company is moving that way by necessity (demand destroyed), but the business model deteriorates.
Praj GenX pre-revenue burn: The Mangalore facility carried ₹10 Cr of monthly fixed overhead in FY26 with near-zero revenue. It’s a long-term bet, but it hammered FY26 reported numbers.
Exceptional items: FY26 posted exceptional charges of ₹264 Cr. The Q3 call (Feb 2026) disclosed a ₹334 Cr gratuity charge tied to some restructuring. That charge washed through Q3, further compressing the year.
On the concall, management said it is “completely geared up” for “operational excellence” in FY27, implying that the worst of the site-cost escalation has passed. They pointed to project mix shifting toward shorter-cycle brownfield work as evidence margins will stabilize.
5. Market Expectations & Historical Multiples
This section describes how the market is currently pricing the company and how that compares with its own history and peer group. It is descriptive, not predictive.
Metric
Current
Historical Average (5yr)
Peer Median
P/E
326
45
31
EV/EBITDA
31.2
~18
23
P/B
4.83
~3.5
3.78
ROE
1.4%
12.5%
11.5%
ROCE
6.3%
18%
14.4%
The market currently pays 326x earnings. That ratio exists because the denominator collapsed—EPS fell 89% in one year, so even a stagnant share price (down 32% over the past year to ₹345) yields a grotesque multiple. This is not the market rating the company expensive; it’s the P/E ratio becoming a nonsense number when the business is in freefall.
The ratio signals that the company’s historical valuation multiple—in the 40–50x range in recent years—has vanished. If earnings stabilize, the multiple should reset. Whether it resets to 40x (fair value circa ₹52–58 per annualized normalized EPS) or 25x (₹32–40) depends on whether “operational excellence” fixes the execution disease.
The company’s own 5-year average P/E sits at 45. Its peers (industrial capital goods, contract engineering) trade in the 28–35x range. The current 326x is an artifact of a company in transition, not a valuation