1. At a Glance
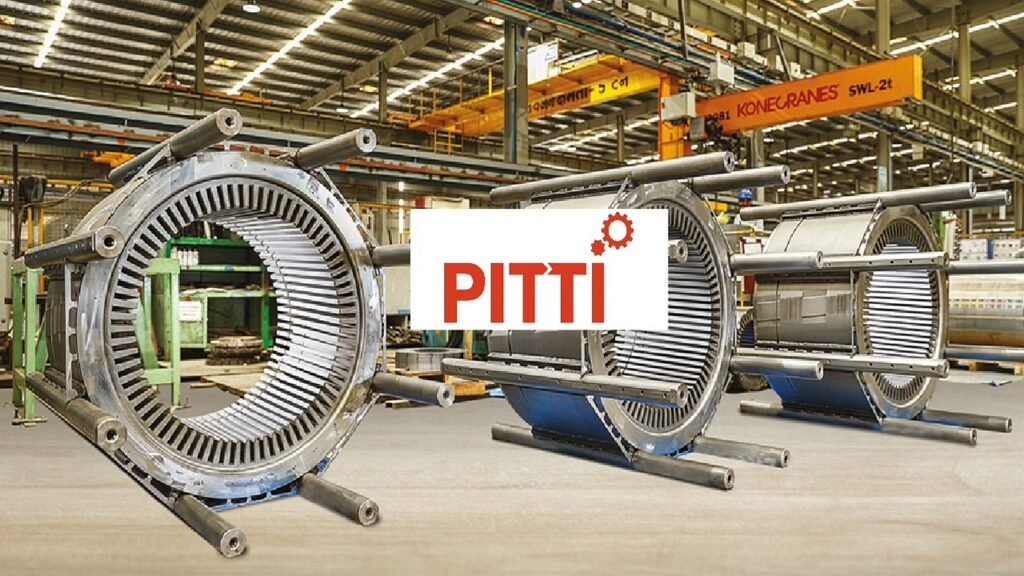
Pitti Engineering isn’t a household name — unless your house happens to be a motor factory. They’re India’s largest electrical steel lamination maker, churning out the hidden guts of motors, generators, and industrial beasts. FY25 clocked ₹1,547 Cr in sales, ₹106 Cr PAT, and a P/E of 33.8, which is modest compared to some “market darlings” but high enough that expectations are baked in like epoxy resin in a motor core.
2. Introduction
Founded with the sole ambition to make life easier for motor manufacturers and harder for competitors, Pitti Engg. is now a global supplier of laminations, motor cores, sub-assemblies, die-cast rotors, and precision-machined parts.
The company has built its name in a niche that’s critical yet invisible to the end customer. Your train, industrial compressor, wind turbine, or heavy-duty pump might owe its heartbeat to a Pitti product. With operations in India and a healthy export footprint, the business is now flexing with a ₹150 Cr capex plan to expand capacity over the next 18 months.
And while promoters have trimmed stake from 59.3% to 54.17% in three years, the underlying business has delivered a profit CAGR of 44% over 5 years. Not too shabby for a company whose products most people will never see.
3. Business Model (WTF Do They Even Do?)
The value chain here is all about precision manufacturing for electromechanical equipment:
- Electrical Steel Laminations– The bread-and-butter; core material for motors and generators.
- Motor Cores & Sub-Assemblies– Ready-to-fit solutions for OEMs.
- Die-Cast Rotors– Key component for electric motors.
- Machined Components– Heavy-duty parts for diverse industries.
Customers include railways, renewable energy OEMs, automotive, industrial equipment makers, and power generation companies. Around40%+ of sales are export-linked, giving them insulation from purely domestic demand swings.
4. Financials Overview
- TTM Sales:₹1,547 Cr
- TTM EBITDA:₹258 Cr
- TTM PAT:₹106 Cr
- EPS:₹28.68
- P/E:33.8
- ROE:16.4%
- ROCE:16.0%
- OPM:17%
10-year sales CAGR is 16%, but the last 5 years have seen faster growth at 24%, with profit CAGR at a stunning 44%. FY25 saw 17% YoY revenue growth and 19% OPM in the latest quarter, supported by operational leverage and exports.
5. Valuation (Fair Value RANGE)
Method 1 – P/EEPS = ₹28.68Sector range for industrial manufacturing: 22–28×FV = ₹631 – ₹803.
Method 2 – EV/EBITDAEBITDA ≈ ₹258 CrNet debt ≈ ₹687 Cr – cash ≈ ₹650 Cr net debtEV


