1. 🧠 At a Glance
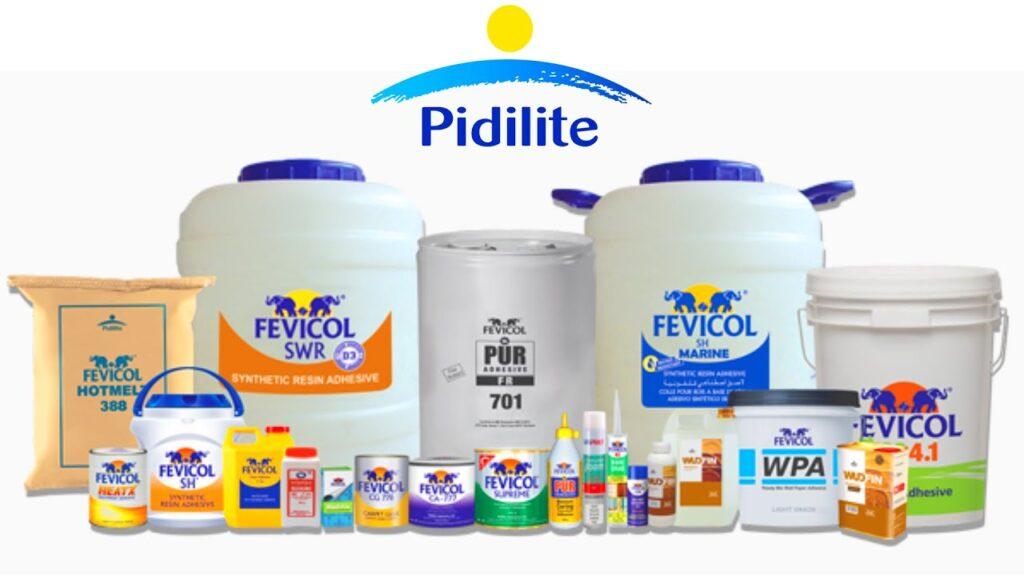
Pidilite Industries, the Fevicol-fueled glue god of India, is the kind of stock you hold when you believe in India’s home improvement dreams. With a 70% promoter holding and iconic brands like Fevicol, M-Seal, Dr. Fixit, and Fevikwik, it’s the spiritual guardian of Indian jugaad. But with a P/E of 73 and working capital days shooting from 24 to 113, the question is: has this stock stuck itself into a valuation trap?
2. 🎥 Introduction with Hook
Imagine being so dominant that your product name becomes the category. That’s Pidilite.
- You don’t say adhesive. You say Fevicol.
- You don’t say waterproofing. You say Dr. Fixit.
But in FY25, this king of craft and chemicals is facing a sticky situation:
- Operating margins are flat YoY
- Working capital stress is rising
- Revenue growth is slowing (6% TTM growth vs. 12% 5Y CAGR)
So is this just a temporary dry spell? Or has the glue lost its grip?
3. 🏢 Business Model (WTF Do They Even Do?)
Pidilite operates in two main verticals:
A. Consumer & Bazaar (80% of revenue)
- Adhesives & sealants (Fevicol, Fevikwik, M-Seal)
- Construction & paint chemicals (Dr. Fixit, Roff)
- Art, craft, and DIY (Fevicryl, Hobby Ideas)
B. Industrial Products (20% of revenue)
- Industrial adhesives
- Resins, pigments, emulsions
Pidilite has ~6,500 SKUs across categories and operates in 70+ countries. This is not your average chemical company — it’s a consumer brand empire that happens to sell glue.
4. 📈 Financials Overview – Profit, Margins, ROE, Growth
| Metric | FY21 | FY22 | FY23 | FY24 | FY25 |
|---|---|---|---|---|---|
| Revenue (Cr) | 7,293 | 9,921 | 11,799 | 12,383 | 13,140 |
| Net Profit (Cr) | 1,126 | 1,207 | 1,289 | 1,747 | 2,096 |
| OPM (%) | 23% | 19% | 17% | 22% | 23% |
| ROCE (%) | 28% | 25% | 24% | 30% | 30% |
| ROE (%) | 22% | 22% | 23% | 23% | 23% |
- Profits have grown at 13% CAGR (5Y)
- Margins have normalized after post-COVID raw material spike
- ROE and ROCE remain elite despite rising working capital
5. 🔢 Valuation – Is It Cheap, Meh, or Crack?
- P/E: 72.9x (vs. 5Y avg of ~65x)
- P/B: 15.6x (vs. Book Value ₹192)
- EV/EBITDA: ~46x (estimated)
This stock is not cheap. It’s not even “meh.” It’s basically Bonded Valuation.
Fair Value Range Calculation:
Assume:
- EPS FY25: ₹40.82
- Fair P/E range: 45x to 55x
FV = ₹1,837 to ₹2,245
Current price ₹3,001 = ❌ 33-60% above FV range
6. 🎭 What’s Cooking – News, Triggers, Drama
- 🔴 Leadership shuffle: Bharat Puri’s term ended; Sudhanshu Vats now MD, Kavinder Singh Joint MD
- 📉 Penalty Trouble: ₹16.97 Cr in penalties across two orders (June 2024)
- 🏢 New Factory: Automated Roff unit in UP (Feb 2024)
- 🚀 Startup Plays: Buildnext, Wify investments via Pidilite Ventures
- ✅ Product Launches: New Fevikwik SKUs in April 2024
7. 💳 Balance Sheet – How Much Debt, How Many Dreams?
- Total borrowings: ₹454 Cr (FY25)
- Debt/Equity: 0.05x
- Reserves: ₹9,704 Cr
- Cash & equivalents: healthy
Pidilite is basically debt-free and runs like a well-oiled cash cow.
8. 💵 Cash Flow – Sab Number Game Hai
| Year | CFO (Cr) | CFI (Cr) | CFF (Cr) | Net Cash Flow (Cr) |
|---|---|---|---|---|
| FY23 | 1,558 | -899 | -656 | +2 |
| FY24 | 2,724 | -1,769 | -742 | +212 |
| FY25 | 2,287 | -1,542 | -918 | -173 |
- Strong operating cash consistently
- High capex outflows show investment in growth
- Free cash flow positive
9. 📊 Ratios – Sexy or Stressy?
- ROE: 23% (FY25)
- ROCE: 30%
- Inventory Days: 103
- Debtor Days: 50
- CCC: 68 days
- Working Capital Days: Shot up to 113 from 24 (watchlist!)
Despite the jump in WC days, returns on capital are stellar. But watch inventory build-up.
10. 📊 P&L Breakdown – Show Me the Money
| Quarter | Sales (₹ Cr) | Operating Profit | OPM % | Net Profit (₹ Cr) |
|---|---|---|---|---|
| Mar 2024 | 3,141 | 632 | 20% | 428 |
| Dec 2024 | 3,369 | 798 | 24% | 557 |
| Sep 2024 | 3,235 | 768 | 24% | 540 |
| Jun 2024 | 3,395 | 812 | 24% | 571 |
- FY25 was a recovery year with stable topline and margin expansion
- Quarterly profit has rebounded after weak FY23
11. 🌎 Peer Comparison – Who Else in the Game?
| Company | P/E | ROCE | OPM | Revenue (Cr) | Market Cap (Cr) |
|---|---|---|---|---|---|
| Pidilite | 72.9 | 30% | 23% | 13,140 | 1,52,623 |
| Deepak Nitrite | 38.9 | 17% | 13% | 8,282 | 27,105 |
| Navin Fluorine | 87.1 | 11.7% | 22.7% | 2,349 | 25,147 |
| Atul | 44.6 | 12.8% | 16.4% | 5,583 | 21,735 |
| Vinati Organics | 48.2 | 20.5% | 26% | 2,248 | 20,014 |
Pidilite is the most expensive among peers — but also the most brand-heavy. You’re not just paying for glue, you’re paying for dominance.
12. 👤 Miscellaneous – Shareholding, Promoters
- Promoter Holding: 69.49% (Steady, strong)
- FII Holding: 11.6%
- DII Holding: 9.43%
- Public: Just 9.47%
Ultra-high promoter confidence, tight float. Feels like a consumer FMCG stock more than a chemical player.
13. 🧑🎓 EduInvesting Verdict™
Pidilite is not a value stock. It’s a prestige compounder. You’re not buying this for EPS, you’re buying it for Fevicol memes, cash flow consistency, and ROCE royalty. But at 73x earnings, even Fevikwik might struggle to justify the price.
Verdict: Elite brand. Elite margins. Expensive as hell. Buy the dips? Nope. Just stick around and watch.
FV Range: ₹1,837 – ₹2,245
Current Price: ₹3,001 (as of 11 July 2025)
Tags: Pidilite Industries, Fevicol, Adhesives Market, Chemical Stocks India, Bharat Puri, Specialty Chemicals, FMCG Chemical Crossover, EduInvesting
✍️ Written by Prashant | 🗓️ 12 July 2025
