Panchmahal Steel Ltd Q2 FY26 – The Stainless Steel Company That’s Rusting Faster Than It Polishes
1. At a Glance
Panchmahal Steel Ltd (BSE: 513511), Gujarat’s proud producer of “stainless” steel, is currently trading at ₹272, down 4% on 17 Oct 2025 — but not nearly as much as its profit, which fell 69% QoQ. The company has a ₹518 cr market cap, 73.8% promoter holding, and a P/E ratio that refuses to exist because the EPS is negative (-₹0.91). Return on equity? 2.1%. Return on courage? infinite — because surviving with a 2% margin in India’s steel jungle deserves applause.
Q2 FY26 revenue stood at ₹92.6 cr (-6.5% QoQ), PAT ₹0.55 cr (-69% QoQ), and OPM 3.4%. Book value is ₹80.3, and the stock trades at 3.4× BV — clearly, investors are paying a premium for nostalgia.
There are two kinds of Gujarati exports: one that goes to the US (diamond polishers), and one that polishes rods till it can’t pay its own interest. Panchmahal Steel is the second kind. Founded in 1972, back when India was still figuring out colour television, the company now finds itself competing against heavyweights like Ratnamani Metals, APL Apollo, and Shyam Metalics — all bench-pressing balance sheets while Panchmahal struggles to lift its OPM above 5%.
In FY25–26, when even steel prices were recovering, Panchmahal somehow found a way to shrink its top line by 8%. Its profit growth is –130% TTM — that’s not a typo, that’s a warning sign with a fancy serif font.
And yet, the stock has given 21% returns over the past year. Because the Indian market loves pain — especially when it’s stainless.
3. Business Model – WTF Do They Even Do?
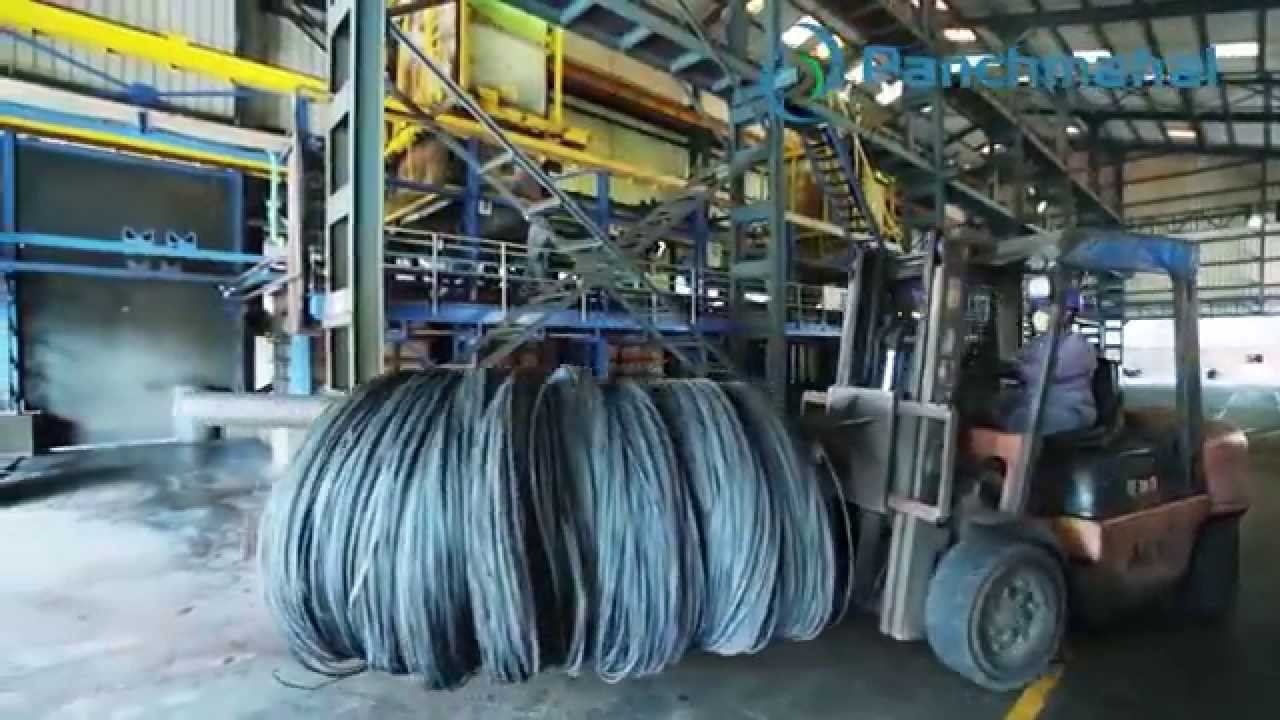
Imagine taking molten steel, adding some chromium for shine, and then running it through enough machines to call it “long products.” That’s basically Panchmahal’s business — bars, rods, and wires. Lots of wires.
Their product list reads like a syllabus:
Stainless Steel Wire Rod & Bars
Stainless Steel Wires
Welding Wires
Fine Wires (because “thin” is a market segment now)
The company serves every imaginable industry — engineering, automotive, consumer durables, pharma, food processing, and housing. In short, they make rods that eventually become someone else’s profit margin.
Exports form 20% of revenue, so 80% of the pain is domestic. Capacity? 1.5 lakh MTPA steel melting + 72,000 MTPA bars and wires. On paper, that’s plenty. In profit, that’s peanuts.
So yes, they melt steel — but it’s their margins that really liquefy.