Search for Stocks /

Pakka Limited FY26: ₹744 Crore Bet, ₹18 Crore Profit

Spotted a factual error — a wrong number, date, or fact? Tell us and we will check the source.

General information and entertainment, not investment advice. The author is not a SEBI-registered adviser or research analyst. No recommendation, no promised returns. Markets carry risk including loss of capital. Figures may not be current. Consult a registered adviser before acting.


1 — At a Glance

Pakka Limited closed FY26 with revenue of ₹356 crore — down 12% from FY25’s ₹406 crore — and net profit of ₹18 crore, a 68% collapse from ₹57 crore a year prior. Operating margins compressed from 19% to 12%. The company is simultaneously operating a ₹744 crore expansion project (Project Jagriti), has refinanced its debt through ₹540 crore of non-convertible debentures at an effective rate of 16.95%, and carries borrowings that ballooned from ₹204 crore in FY25 to ₹458 crore in FY26.

The numbers that demand attention: ROCE fell to 4.42% — against a 5-year average north of 18%. ROE sits at 3.65%. The company’s total assets have grown from ₹518 crore in FY24 to ₹1,152 crore in FY26, almost entirely on the back of capital work-in-progress, which jumped from ₹35 crore to ₹555 crore. Capital work-in-progress now accounts for roughly half the balance sheet.

One wisdom drop: a company in heavy capex is often trading today’s returns for tomorrow’s capacity. Whether the capacity materialises on schedule is, historically, the part that varies.

The central tension: Pakka is a ₹386 crore company carrying ₹744 crore of expansion ambition, funded at nearly 17% interest, with its CFO just resigned and its credit rating freshly downgraded to BB+. The next twelve months are either the setup for a very different P&L, or a very different debt conversation.


2 — Introduction

Pakka Limited — incorporated in 1981, formerly Yash Pakka Limited until July 2023 — manufactures specialty paper and packaging products at its facility in Ayodhya, Uttar Pradesh. The company operates two segments: Paper & Pulp (the dominant business) and Moulded Products (the “Chuk” branded bagasse tableware business). It exports to over 31 countries, with domestic revenue at roughly 75% of the mix as of FY24.

FY26 was not a year to file away quietly. The company undertook a planned shutdown of its manufacturing unit from June 16 to July 24, 2025, as part of Project Jagriti’s phased rollout. The shutdown — intended to be 20 days, extended to approximately 40 days per management — hit Paper & Pulp revenue hard, eliminating pulp sales during that window. The Wrap & Carry (Paper & Pulp) segment’s full-year volume fell 17%, with PBT dropping approximately 50%, per the investor presentation.

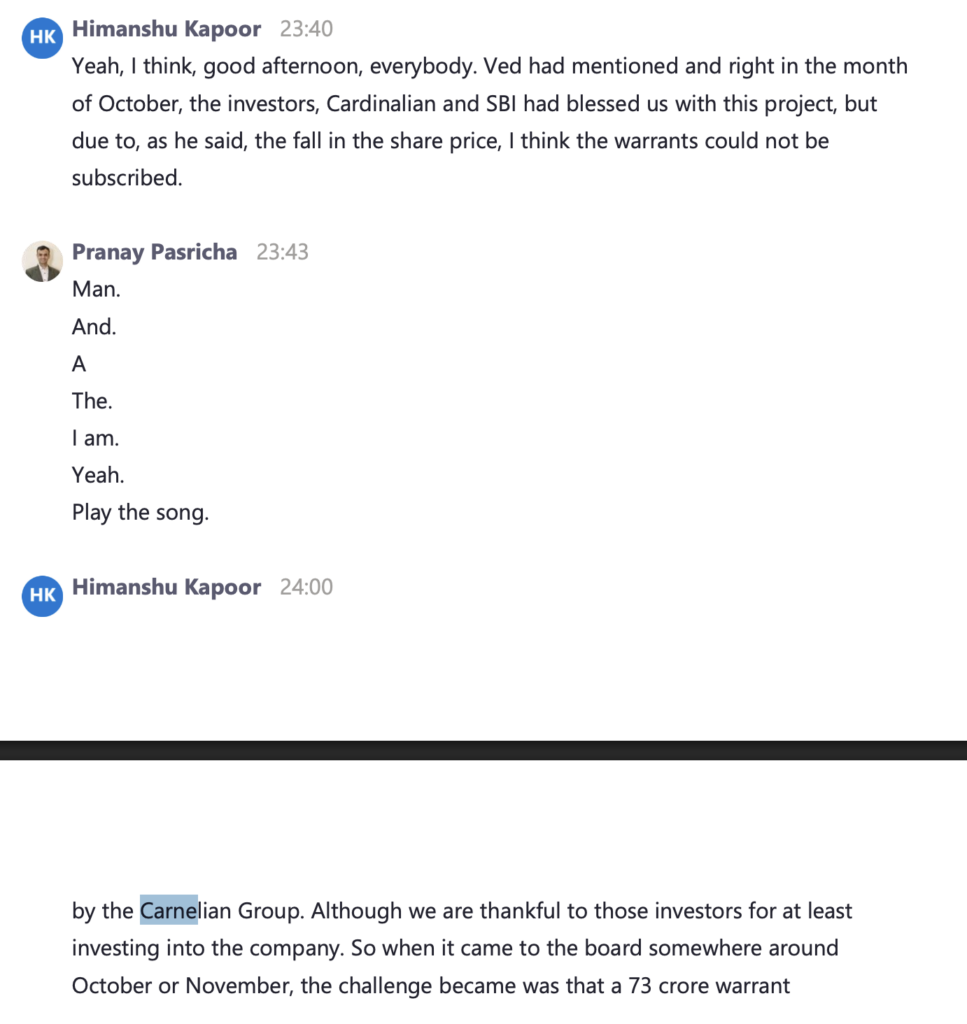
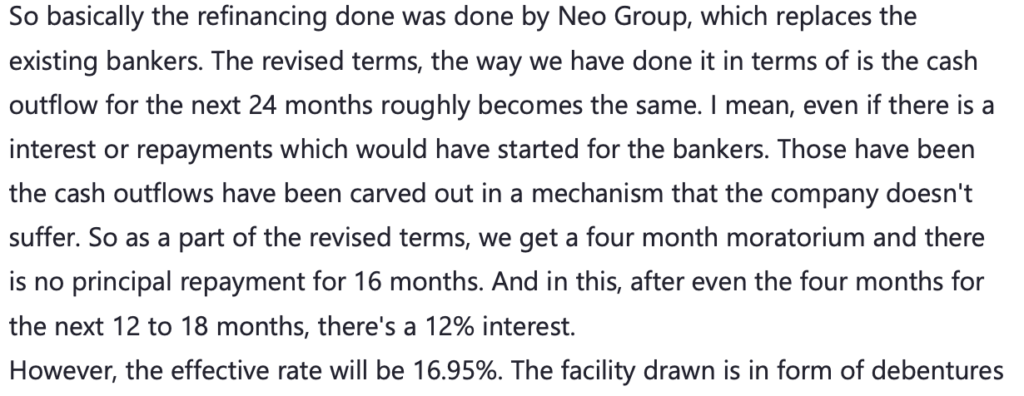
Simultaneously, the funding structure for Project Jagriti came undone. The original plan had included warrant proceeds alongside bank debt. When the share price fell below the warrant exercise price, one investor — Carnelian — did not honour warrants, creating a shortfall management described as approximately ₹300 crore, per the Q4 FY26 concall. The company refinanced by issuing ₹540 crore of NCDs through Neo Group at an effective interest rate of 16.95%.

In June 2026, the company allotted 27.2 lakh equity shares and 77 lakh warrants, raising up to ₹114.62 crore. On June 4, 2026, promoter Ved Krishna pledged 1,26,81,678 shares — 28.21% of capital — as security for the debenture holders, per the SAST disclosure. On June 9, CARE Ratings downgraded Pakka’s ₹630.94 crore of bank facilities to BB+/A4+ and moved them to Issuer Not Cooperating, citing non-availability of information. On June 16, CFO Neetika Suryawanshi resigned, effective June 30, 2026, citing personal reasons.


3 — Business Model: WTF Do They Even Do?

Pakka makes paper from bagasse — the fibrous residue left after sugarcane is crushed for juice. It is, in essence, a company that took something the sugar industry throws away and decided to build a specialty packaging business around it. The plant sits in Ayodhya, Uttar Pradesh, which also happens to be India’s sugarcane heartland, so raw material isn’t the problem. The problem is everything downstream of the bagasse.

The Paper & Pulp segment produces machine-glazed agro-based paper — 30 to 100 GSM — in unbleached kraft, bleached kraft, and coloured kraft varieties. This paper goes into food carrying materials. The segment also produces agro pulp used in specialty papers: greaseproof, glassine, release base, parchment. Clients include names like Borosil, Haldiram’s, Chai Point, and Blinkit. It is not consumer-facing; it is the paper your food came wrapped in before you threw it away without noticing.

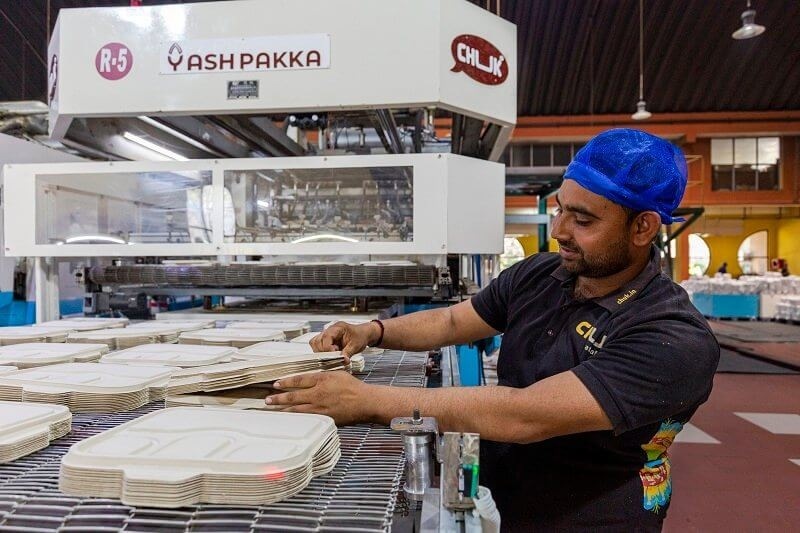
The Moulded Products segment — branded “Chuk” — makes compostable bagasse tableware: bowls, plates, trays, cups, cutlery. It entered this segment in 2018, and FY26 volume grew to 3,100 metric tonnes from 2,600 metric tonnes, according to the investor presentation. Revenue from food services reached ₹63 crore in FY26. The catch: the segment ran a loss of ₹10.84 crore for the year, driven by manufacturing/plant losses and one-off non-cash items, per management’s breakdown.

The integrated model is genuinely clever on paper: captive power plant (8.8 MW, rice husk-fired), in-house soda recovery plant (145 MTPD capacity recovering caustic soda), and domestic bagasse sourcing within a 100-km radius. CARE noted that Pakka’s cost of procurement is competitive against peers and industry trend. The efficiencies are real. The scale, however, is being tested by Project Jagriti — a capacity expansion from 136 MTPD to 246 MTPD — which has encountered cost escalation (total project cost revised to ₹744 crore), timeline extensions (commercial operation date now January 1, 2027), and debt refinancing at 16.95%.

Does a 2,700 bps operating margin swing over five years — from 15% in FY15 to 21% in FY23, then back to 12% in FY26 — reflect the difficulty of the model, or the disruption of a one-time expansion? The filings don’t settle which.


4 — Financials Overview

Figures are standalone, in ₹ crore.

Annual P&L Summary

MetricFY26FY25YoY
Revenue356406-12%
EBITDA*~53~93-43%
PAT1857-68%
EPS (₹)4.0412.61-68%

*EBITDA approximated as PBT + Interest + Depreciation: ₹25 + ₹11 + ₹17 = ₹53 crore for FY26; ₹67 + ₹10 + ₹16 = ₹93 crore for FY25.

Q4 FY26 (Standalone)

MetricQ4 FY26YoYQoQ
Revenue102+10.2%+5.6%
Operating Profit10.16-44%-35%
PAT3.84-69%-58%
EPS (₹)0.85-69%-58%

Concall Highlights (Q4 FY26, June 2026)

Management attributed the full-year revenue decline of approximately 13% primarily to the PM3 outage and the resulting disruption to pulp sales, per the concall. The PM3 shutdown — planned at 20 days, extended to approximately 40 days — management quantified as an ₹11 crore impact on PBT. Pricing pressure from new entrants was quantified as a ₹16 crore impact. Management said the PM3 modification was expected to complete in the fourth week of June, adding approximately 10 TPD of production and an estimated ₹8 crore to PBT.

On the Food Services segment, management described the elevated loss as comprising approximately ₹3 crore of manufacturing/plant losses during a transition year and approximately ₹3 crore of one-off non-cash items (inventory write-offs, old packaging materials, project development costs). Management framed these as non-recurring.

On the funding restructure, management acknowledged the value impact directly: “We are totally responsible for eroding your wealth,” per the concall transcript, and linked near-term recovery to Jagriti commissioning and product traction.


5 — Market Expectations & Historical Multiples

This section describes how the market is currently pricing the company and how that compares with its own history and peer group. It is descriptive, not predictive.

MetricCurrentHistorical AveragePeer Median
P/E21.3x17.7x
EV/EBITDA15.5x
P/B0.72x
ROE3.65%15% (5-yr)
ROCE4.42%6.28%

The market currently pays 21.3x earnings here, against a peer median of 17.7x. The P/B multiple of 0.72x places the market’s valuation of the business below its stated book value. ROCE at 4.42% sits below the peer median of 6.28%.

The market appears to be pricing in a recovery scenario tied to Project Jagriti’s commissioning: a company with historically demonstrated margins of 19-21% and ROCE above 20% in FY22-FY23, now temporarily compressed by a capex cycle and a planned production shutdown. The 21x earnings multiple, against depressed FY26 earnings, implies the market is looking through current-year results toward a normalised earnings base. Whether that normalised base materialises depends on Jagriti’s commissioning timeline, now extended to January 2027, and the effective cost of 16.95% debt.

One factual observation: the market pays 21.3x earnings on a year when ROCE was 4.42% — a gap that encodes a specific expectation about what the next P&L looks like.


6 — What’s Cooking

Project Jagriti’s revised total cost is ₹744 crore. As of December 2025, the company had incurred ₹465.41 crore (~62.56% of total capex), with physical progress at 57.61% and financial progress at 69.36%, per the CARE rating report. The commercial operation date has been extended to January 1, 2027 — previously August 1, 2026 — per CARE, with cost escalation of ₹67.74 crore attributable to delays in financial closure, PM4 redesigning, and adverse forex movements.

On June 2, 2026, Pakka allotted ₹375 crore in NCDs to Neo AIFs under the ₹540 crore NCD issue. On June 9, the company allotted 27.2 lakh equity shares at ₹110 per share (₹29.92 crore) and 77 lakh fully convertible warrants (25% upfront: ₹21.18 crore) to Yash Agro Products Limited, a promoter group entity, raising up to ₹114.62 crore in aggregate.

On June 4, 2026, Ved Krishna pledged 1,26,81,678 shares — 28.21% of total capital — in favour of Catalyst Trusteeship Limited as debenture trustee for the NCD holders. Promoter pledging now stands at 76.7% of promoter holding per the data sheet.

CARE downgraded Pakka’s ₹630.94 crore of facilities to BB+/A4+ on June 9, 2026, moving to Issuer Not Cooperating on the grounds that the company did not provide requisite information despite repeated requests.

CFO Neetika Suryawanshi resigned effective June 30, 2026.


7 — Balance Sheet

Figures are standalone, in ₹ crore.

ItemFY24FY25FY26
Total Assets5187681,152
Net Worth265488506
Borrowings182204458
Other Liabilities7176187
Total Liabilities5187681,152

Assets = Liabilities confirmed for all three years.

Three observations the numbers make:

— Borrowings more than doubled in one year, from ₹204 crore to ₹458 crore, while net worth grew only ₹18 crore. The balance sheet is acquiring debt faster than it is retaining earnings.

— Capital work-in-progress went from ₹35 crore in FY24 to ₹143 crore in FY25 to ₹555 crore in FY26. Project Jagriti now inhabits nearly half the asset base and has yet to produce a rupee of revenue.

— Other Liabilities more than doubled to ₹187 crore in FY26, reflecting the complexity of a refinancing that brought in NCDs, deferred obligations, and new security structures simultaneously.

The balance sheet of a company mid-capex looks like this: heavy on the left side, light on the right. Whether the left side eventually earns its place depends on the right side’s patience.

Net cash per the balance sheet is negative: borrowings of ₹458 crore against cash and bank balances of approximately ₹22 crore (₹18 crore cash + ₹4 crore bank balances per the data sheet’s approximate read).


8 — Cash Flow: Sab Number Game Hai

Figures are standalone, in ₹ crore.

YearOperatingInvestingFinancing
FY2453-7574
FY2523-191180
FY2674-366245

In FY26, operating cash flow recovered to ₹74 crore — the best in three years — while the company simultaneously deployed ₹366 crore in investing activities, almost entirely into Project Jagriti’s capex. The financing side raised ₹245 crore, reflecting the NCD issuance and equity/warrant proceeds.

Free cash flow for FY26 was negative ₹280 crore. For two consecutive years, the company has consumed more cash than it generated. CFO/Operating Profit stood at 201% in FY26 — a meaningfully high ratio that reflects non-cash charges (depreciation, provisions) being large relative to operating cash needs during this construction phase.

The money is clearly flowing in one direction: into a hole in the ground in Ayodhya that is expected to become a paper machine by January 2027.

One wisdom drop: cash flow from operations and reported profit diverge most visibly when depreciation is heavy and working capital is in motion. A ₹74 crore operating cash flow against ₹18 crore PAT reflects exactly that — not manipulation, just the accounting of an asset-heavy business mid-build.


9 — Ratios: Sexy or Stressy?

RatioValue
ROE3.65%
ROCE4.42%
P/E21.3x
PAT Margin5.1%
D/E0.90x

ROE at 3.65% means equity is working at roughly a tenth of its five-year average of 15% — the capital employed in Project Jagriti’s CWIP is drawing no returns yet.

ROCE at 4.42% is the lowest this decade; in FY22 and FY23, it was 26% and 28% respectively. The ratio measures returns on all capital deployed, and a ₹555 crore CWIP item that earns zero currently does considerable arithmetic damage.

PAT margin at 5.1% compares to 14% in FY25 and 12.5% in FY24. The compression reflects both the revenue decline and the fixed-cost absorption problem of running at lower utilisation while depreciation climbs — FY26 depreciation of ₹17 crore vs ₹4 crore in FY15.

D/E at 0.90x is, in isolation, not alarming. The quality of debt matters more here: ₹540 crore at 16.95% effective rate, with no principal repayment for 16 months per the refinancing terms, is a very specific type of 0.90x.

Interest coverage at 3.21x remains above 1 — the business covers its interest — but the headroom has narrowed sharply from 8.0x in FY25.


10 — P&L Breakdown: Show Me the Money

Figures are standalone, in ₹ crore. EBITDA = PBT + Interest + Depreciation.

YearRevenueEBITDAPAT
FY244059649
FY254069357
FY263565318

Revenue had stabilised at ₹405-406 crore for two consecutive years before falling 12% in FY26, per the data sheet. The fall, per the CARE report, was primarily attributable to reduction in net sales realisations across the industry, compounded by the planned shutdown reducing volumes in Q1 and Q2 FY26.

EBITDA fell from ₹93 crore to ₹53 crore — a 43% drop — reflecting both the revenue decline and the operating leverage working in reverse. Fixed costs (power, depreciation, employee costs) don’t flex when machines are shut for 40 days.

The ten-year arc is worth noting: revenue grew from ₹172 crore in FY15 to a peak of ₹408 crore in FY23, while PAT grew from a loss of ₹7 crore to ₹51 crore over the same period. The 10-year profit CAGR is 20%. FY26 is the third consecutive year of declining PAT from the FY23 peak of ₹51 crore.

The segment data in the investor presentation adds texture: Paper & Pulp contributed ₹304 crore in FY26 revenue against ₹367 crore in FY25 (down 17%), while Moulded Products grew from ₹57 crore to ₹63 crore (up 12%). The growth story in Moulded is intact by volume and revenue; it simply hasn’t reached profitability yet.


11 — Peer Comparison

Figures from the Screener peer table (latest quarter).

CompanyRevenue (Qtr, ₹ Cr)PAT (Qtr, ₹ Cr)P/E
JK Paper1,96689.6822.6x
West Coast Paper1,24553.9821.7x
Seshasayee Paper59226.0516.3x
Pudumjee Paper20119.728.6x
Pakka1023.8421.3x
Peer Median (25 co.)1827.1717.7x

Pakka is the smallest company in this table by quarterly revenue — ₹102 crore against JK Paper’s ₹1,966 crore. Yet the market pays 21.3x, above the peer median of 17.7x. Pudumjee Paper, which runs a 19.8% ROCE against Pakka’s 4.42%, trades at 8.6x. JK Paper, with quarterly PAT 23 times larger than Pakka’s, trades at 22.6x — marginally above Pakka.

The multiple premium against peers and the multiple discount to book value exist simultaneously — a combination that encodes the market’s view of a company whose current earnings are considered suppressed by circumstance rather than structural.


12 — Miscellaneous: Shareholding & Promoters

Holder%
Promoters41.65%
FIIs0.17%
DIIs8.02%
Public50.16%

Promoter holding has declined from 47.8% in September 2023 to 41.65% currently — a fall of 6.15 percentage points over roughly two and a half years. Of the remaining 41.65%, 76.7% is pledged.

The dominant promoter entity is Ved Krishna, MD, holding 30.8% individually. Krishna Kumar Jhunjhunwala (the late founder’s family entity) appears in the shareholding table; the company was founded in 1981 by the late KK Jhunjhunwala. Management is now led by Ved Krishna, with over 25 years of industry experience per CARE.

The DII holding of 8.02% is almost entirely SBI Magnum Children’s Benefit Fund – Investment Plan. That is, a children’s fund holds the largest institutional stake in a company mid-way through a ₹744 crore expansion whose funding required emergency refinancing at 16.95%. The fund’s risk team presumably has opinions.

The promoter’s pledge position is the number that concentrates attention: 76.7% of promoter holding pledged, with a fresh pledge of 1,26,81,678 shares (28.21% of total capital) created on June 4, 2026, in favour of NCD holders. Promoter holding decline plus pledge acceleration is the combination that governance watchers flag first.


13 — Corporate Governance: Angels or Devils?

The record for FY26 contains several items that are factual rather than editorial.

CARE Ratings downgraded Pakka to BB+/A4+ on June 9, 2026, and moved it to Issuer Not Cooperating after the company did not provide requisite information despite requests on June 1, 2, and 3 and numerous phone calls. Brickwork and India Ratings had previously placed Pakka in Issuer Not Cooperating categories in June 2025 and July 2025 respectively.

CFO Neetika Suryawanshi resigned effective June 30, 2026, citing personal reasons.

Promoter pledging stands at 76.7% of promoter holding. Ved Krishna created an additional pledge of 1,26,81,678 shares on June 4, 2026, per the SAST disclosure.

36 lakh preferential warrants issued in the prior fundraise lapsed on April 13, 2026, with ₹24.48 crore of upfront money forfeited.

The board approved the extension of the company’s TSOP-2021 (stock option plan) end date from December 31, 2026, to December 31, 2031, and issued a new Tranche IV comprising 1,24,500 ESOPs at an exercise price of ₹152.31 per option.

The auditors (CNK & Associates LLP) issued an unmodified opinion. The emphasis of matter noted that a Guatemala manufacturing facility construction has been temporarily paused, with the company’s view that no impairment is warranted.

The statutory audit is clean. The governance signals outside the audit require reading on their own terms.


14 — Industry Roast & Macro Context

The paper packaging industry: where raw material is literally agricultural waste, the end product is immediately discarded by the consumer, and yet the capital intensity rivals a semiconductor fab. Welcome to the world of specialty paper.

The competitive structure is what happens when the word “eco-friendly” became a marketing asset before the economics got sorted. The industry runs on bagasse, rice husk, and old newspapers, competes with plastics that are cheaper and better at their jobs, and operates under CPCB classification as one of the more environmentally impactful sectors — extensive freshwater use, wastewater, sludge — while simultaneously marketing itself as the sustainable alternative. The central pitch is correct; the economics of being correct are difficult.

CARE notes that the paper packaging industry is highly competitive with intense competition from organised and unorganised players, limiting pricing power and pressuring profitability. Management in the Q4 concall specifically called out low-cost waste-paper-based producers circumventing regulations on primary versus secondary packaging classifications as a competitive pressure, and noted QSR packaging quality “going down significantly” — polite language for: the market is tolerating cheaper, lower-quality product.

The raw material — bagasse — is domestically sourced and agro-based, making it subject to seasonal price volatility. Pricing power at the product level is constrained by a fragmented market; cost efficiency at the input level is constrained by sugarcane seasonality. The gap between those two constraints is where the margin lives, and it is not a wide gap.

The one tailwind: the regulatory direction on single-use plastics is genuinely supportive of the business model. The speed of that tailwind converting to pricing power is a different question.


15 — EduInvesting Verdict

SWOT

StrengthsWeaknesses
Integrated, low-cost agro-based production modelBorrowings at 16.95% effective rate on ₹540 Cr NCDs
40+ year operating track record; locational advantage for bagasseROCE at 4.42% — decade low
Moulded Products growing volume (3,100 MT in FY26 vs 2,600 MT)76.7% of promoter holding pledged
Captive power (8.8 MW) and soda recovery reducing costsCFO resigned; CARE in Issuer Not Cooperating category
OpportunitiesThreats
PM4 commissioning (January 2027) doubles capacity to 246 MTPDProject Jagriti cost and timeline overruns may recur
Regulatory tailwind on single-use plasticsHigh-cost debt service constrains cash generation
B2C “Chuk” channel grew 2.5x in FY26Promoter holding dilution through warrant conversion
PM3 modification adding ~10 TPD and ~₹8 Cr to PBT, per managementIndustry pricing pressure from unorganised, low-cost players

A company that built its margins from a loss in FY15 to 21% in FY23, then deployed that earnings track record as collateral for a ₹744 crore bet on the same model at twice the scale, is now sitting in the in-between: the old capacity can’t support the new debt, and the new capacity isn’t producing yet. The outcome of FY27 — specifically whether Project Jagriti’s commissioning converts into operating cash flows that begin to service ₹540 crore at 16.95% — will determine which version of this company the next encyclopedia entry describes.

Leave a Reply