P N Gadgil Jewellers Q4 FY26: Revenue Crosses ₹10,700 Crore but Gross Margin Contracts 230 Bps in Structural Gold Investment Shift
1. At a Glance
An ancient heritage matching path with aggressive hyper-growth presents a fascinating paradox. P N Gadgil Jewellers Limited, a household name in Maharashtra with a 194-year legacy, has transformed itself into a listed corporate giant. The latest audited numbers reveal an explosive top-line surge, with full-year sales for FY26 scaling to an unprecedented ₹10,739 crore. This marks an astonishing 39.6% expansion over the previous fiscal year.
Yet, beneath this golden surface of accelerating revenue lies a complex financial reality that demands deep analytical scrutiny. In the final quarter of the year, the company experienced a significant gross margin contraction of approximately 230 basis points year-on-year. This compression was not a random anomaly. It was driven by a fundamental shift in customer behavior: a surge in the purchase of low-margin gold bars and coins, which leaped from 28% to 40% of the sales mix.
Investors are pouring into the stock, mesmerized by the company’s compounding top-line trajectory and its rapid store expansion. Post-IPO, the business has opened 39 new showrooms, bringing its total global footprint to 78 retail outlets. However, this aggressive expansion comes at a heavy structural cost. Operating expenses have ballooned, driven by high upfront setup costs, massive advertising outlays to enter competitive northern markets, and hefty brand ambassador fees.
The cash flow statements expose a deeper vulnerability. For the last three consecutive years, the company’s cash flow from operations has remained deep in negative territory, culminating in a cash deficit of ₹717 crore in FY26. Every rupee generated from operations, along with massive chunks of fresh debt, is being aggressively swallowed by working capital requirements to stock gold inventory across new store shelves. The business is running a high-stakes race, relying on a future margin recovery to balance its heavily strained cash sheets.
2. Introduction
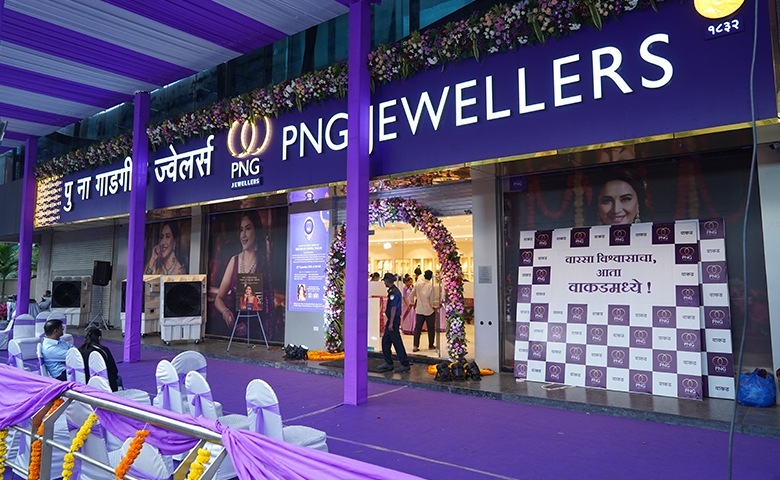
P N Gadgil Jewellers Limited traces its foundational roots back to 1832 in Sangli, Maharashtra. Over six generations, the entity has transitioned from a localized, family-run jewellery shop into India’s fastest-growing organized retail jewellery brand. Listing on the national exchanges in September 2024 via an ₹850 crore initial public offering, the company has utilized its public capital to clean up its balance sheet and fund an ambitious geographical expansion plan.
Operating under the prominent brand “PNG Jewellers,” the company commands a dominant position in western India, particularly across major catchments in Maharashtra and Goa. The brand relies on deep consumer trust and generational loyalty, which translates into remarkable operational metrics. For the full year FY26, the company recorded a spectacular Same-Store Sales Growth (SSSG) of 42.8%, showcasing that its mature outlets continue to attract intense consumer footfalls despite volatile, soaring gold prices.
To capture the evolving preferences of younger demographics, the company launched its “LiteStyle by PNG” format in June 2025. This sub-brand targets Gen Z and millennial buyers with lightweight, design-led 14K, 18K, and 22K gold and diamond jewellery. By creating an distinct product ecosystem with separate design, merchandising, and sourcing teams, the management is attempting to decouple its growth from purely traditional wedding seasons and tap into high-margin, year-round daily wear and corporate gifting segments.
3. Business Model – WTF Do They Even Do?
At its core, the company is a high-volume retail aggregator of precious metals and gemstones. They design, procure, and sell gold, silver, platinum, and diamond jewellery across multiple price points. The traditional retail structure operates via two distinct channels: Company-Owned, Company-Operated (COCO) flagship showrooms, and franchise-led models. While the flagship stores demand massive capital to the tune of ₹55 crore to ₹60 crore per store just for gold and diamond inventory, the franchise network offers a capital-light, bottom-line-accretive mechanism to penetrate Tier-2 and Tier-3 cities.
The underlying operational mechanism is highly centralized. Stores carry customized design portfolios tailored specifically to regional micro-markets. However, procurement remains centrally managed from the corporate headquarters. The company runs an automated inventory system that tracks stock levels in real time. Bi-weekly purchase cycles ensure that fast-moving SKUs are continuously replenished, while a centralized quality control team in Mumbai checks every single item for hallmarking, polish, and stamping before dispatching it to retail floors.
While the business model looks highly lucrative from an absolute revenue perspective, it operates on razor-thin structural spreads. The company does not make money by speculating on gold prices; management utilizes a 100% natural and financial hedging mechanism to insulate the business from price volatility. Instead, the real profitability is derived purely from “making charges” levied on jewellery fabrication.
This brings us to the ultimate structural bottleneck: when consumers shift their preferences from complex, high-margin studded jewellery to plain bullion bars and coins, the company effectively turns into a low-margin delivery desk for gold. Bullion sales yield thin spreads of around 1.5% to 2%, dragging down the performance of the high-margin retail jewellery operations.
4. Financials Overview
A precise evaluation of the latest financial performance requires a deep dive into the consolidated quarterly statements. The final quarter of FY26 witnessed an epic top-line explosion, but a simultaneous contraction in profitability margins due to product-mix distortions.
Quarterly Financial Performance Comparison
Financial Metric
Latest Quarter (Mar 2026)
Same Quarter Last Year (Mar 2025)
Previous Quarter (Dec 2025)
YoY Change (%)
QoQ Change (%)
Revenue from Operations
₹3,544.31 cr
₹1,588.22 cr
₹3,302.61 cr
123.16%
7.32%
EBITDA
₹135.00 cr
₹107.00 cr
₹244.00 cr
26.17%
-44.67%
Profit After Tax (PAT)
₹90.26 cr
₹62.00 cr
₹170.90 cr
45.58%
-47.19%
Reported EPS (₹)
₹6.65
₹4.57
₹12.59
45.51%
-47.18%
Annualized EPS (₹)
₹30.20
—
—
—
—
Note: For the annualized EPS of the latest full year ended March 2026, the full-year actual EPS of ₹30.20 is utilized directly without quarterly multipliers.
The quarterly trajectory shows structural divergence. While sales grew by over 123% year-on-year, EBITDA only managed a modest 26.17% growth,