Oswal Pumps Ltd FY26: The Government’s ₹2,000 Crore Solar Pipeline Meets a 199-Day Debtor Reality
Section 1 — At a Glance
Oswal Pumps Ltd closed its fiscal year 2026 with an aggressive sprint, delivering record annual revenue from operations of ₹2,064.39 crore, representing an impressive 44.34% year-on-year growth. Profit after tax surged by 34.09% to reach ₹376.28 crore, reflecting robust top-line momentum driven by large-scale execution under the PM-KUSUM and allied state solar pumping schemes.
Investor attention is heavily drawn to the company’s commanding 38% market share in the installed base under the PM-KUSUM scheme, backed by an executable near-term pipeline exceeding 25,000 pumps. Furthermore, the successful initial public offering in June 2025 injected ₹897 crore of fresh capital, transforming the balance sheet and expanding net worth to ₹1,682.90 crore.
However, serious challenges lie beneath this growth engine. The company’s cash generation remains highly strained, with cash flow from operations tracking in negative territory at negative ₹77.08 crore for the year, marking two consecutive years of cash drain. This structural deficit is driven by an alarming stretch in debtor collection times, which deteriorated from 160 days to 199 days, severely trapping working capital within state nodal government agencies. High revenue growth tied to a singular regulatory program often introduces asymmetric counterparty risks where corporate liquidity is compromised by municipal administrative delays. While management forecasts a massive capacity ramp up to a ₹6,000 crore revenue ceiling, investors must evaluate whether this business model is building a sustainable enterprise or simply a massive, uncollected government receivable book.
Section 2 — Introduction
Oswal Pumps Ltd has rapidly evolved from a regional agricultural pump fabricator into a heavily integrated renewable engineering player. Listed via a substantial ₹1,387 crore public market debut in mid-2025, the corporate narrative is tightly bound to India’s ambitious state-led agrarian solarization.
The firm specializes in engineering solar-powered and grid-connected submersible and monoblock pumping networks alongside dedicated upstream manufacturing of solar modules, induction motors, and structural arrays. This deep integration provides significant execution control, yet it roots the business directly in the complex bureaucratic dynamics of centralized procurement. This analysis evaluates whether the company’s recent structural transitions can successfully liberate it from state dependency, or if it remains vulnerable to volatile regulatory cycles.
Section 3 — Business Model: WTF Do They Even Do?
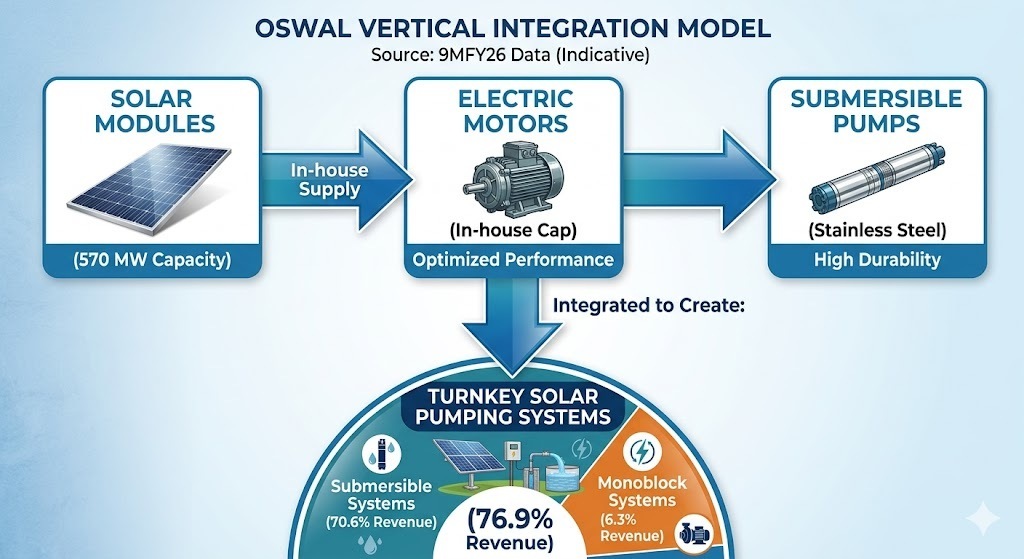
Oswal Pumps operates a vertically integrated production ecosystem where it acts as a primary engineering and manufacturing supplier under institutional tender mandates. Rather than acting as a simple assembly shop, the firm fabricates stainless steel and cast-iron pumps, winds high-capacity submersible electric motors, and processes photovoltaic solar modules up to an installed capacity of 570 MW at its core Karnal facilities.
The revenue architecture is heavily weighted toward Turnkey Solar Pumping Systems, which collectively command 76.9% of the overall product mix (with Submersible setups at 70.6% and Monoblocks at 6.3%). Institutional orders, predominantly under the PM-KUSUM program, account for approximately 81% of all operational billings, leaving traditional retail distribution channels at 19%. Geographically, the operations exhibit intense regional clustering, with Maharashtra single-handedly generating 57.8% of aggregate sales, followed by Haryana at 21%. The business is essentially a specialized engineering extension of state agricultural departments.
Section 4 — Financials Overview
Figures are consolidated, in ₹ crore.
Quarterly Performance Trend
Metric
Mar 2026
Dec 2025
Sep 2025
Jun 2025
Mar 2025
YoY (%)
QoQ (%)
Operational Revenue
509.74
501.07
539.64
513.95
364.64
+39.79%
+1.73%
Operating EBITDA
118.09
127.06
127.98
140.79
98.84
+19.48%
-7.06%
Net Profit (PAT)
92.53
91.56
97.50
94.68
63.90
+44.80%
+1.06%
Reported EPS (₹)
8.12
8.03
8.55
8.31
6.42
+26.48%
+1.12%
The top-line expands rapidly while profit realization shows clear operational resistance. Sequential margins compressed in the final quarter of FY26, with the operating EBITDA margin dropping to 23.17% from 25.36% in the preceding period, penalized by aggressive competitive bidding in recent state tenders and volatile global input prices. Corporate earnings quality is ultimately determined by cash collection efficiency rather