General information and entertainment, not investment advice. The author is not a SEBI-registered adviser or research analyst. No recommendation, no promised returns. Markets carry risk including loss of capital. Figures may not be current. Consult a registered adviser before acting.
1 — At a Glance
Orient Ceratech closed FY2026 with standalone revenue of ₹405 crore, up 22% year-on-year, and PAT of ₹19.8 crore — more than double the ₹9.6 crore of FY2025. The 107% profit jump is the headline number, though it requires context: FY2025 was a compressed base, and ₹12.9 crore of other income sits inside the PAT figure. Strip that out and the operating engine earns more modestly.
On the positive side of the ledger: debt has fallen sharply. Borrowings stand at ₹24 crore on the standalone balance sheet against ₹46 crore in the prior year, and the D/E ratio is a lean 0.08. CareEdge reaffirmed CARE BBB+; Stable in March 2026, citing ~25% revenue growth in 9MFY26 and interest coverage of 8.10x — adequate, per the filing.
On the attention side: ROCE sits at 9.16%, ROE at 6.89%, and the five-year sales CAGR is 6%. A company selling into steel, oil and gas, and cement — all cyclical — that grows revenue at single digits over half a decade is one that the cycle has not yet fully rewarded. Meanwhile, the company is in the process of exiting its entire power division, sold piecemeal over two announcements. The 50-year-old company is becoming, decisively, a materials business.
The central tension: a ₹493 Cr market cap company with clean books, a rebuilding margin story, and a market that pays 25x earnings for the privilege of watching it unfold.
2 — Introduction
Orient Ceratech Limited has been in business since 1971 — initially as Orient Abrasives Limited, a name it carried until May 2023 when it rebranded to reflect the broader ceramics identity. It is part of the Ashapura Group, promoted by Bombay Minerals Limited (BML), itself a subsidiary of Ashapura Minechem Limited.
The FY2026 results, approved by the board on 27 May 2026, show standalone revenue of ₹405 crore and consolidated revenue of ₹404 crore. The auditors — Sanghavi & Company — issued an unmodified opinion on both sets of results. The board recommended a dividend of ₹0.35 per share (face value ₹1), a 35% payout.
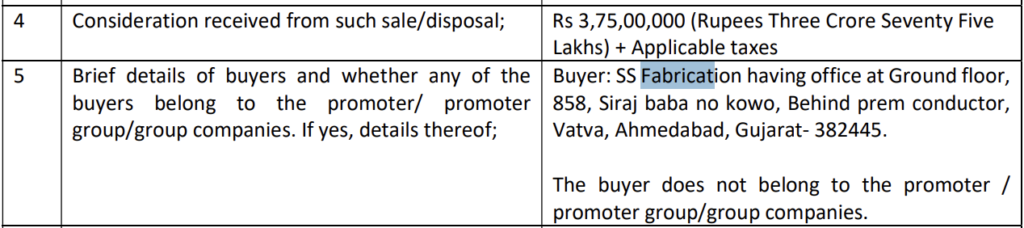
The year also produced a series of announcements that amount to a strategic restructuring of the energy side of the business. In late FY2026, the board approved the sale of the Porbandar thermal power station for ₹3.75 crore to SS Fabrication of Ahmedabad — a captive unit with no separate revenue, carried at a written-down value of ₹3.77 crore on the balance sheet per the filing. Then, on 18 June 2026, the board approved the sale of the windmill division to Greenwin Energy Thirteen LLP for ₹15.25 crore. That division contributed ₹6.27 crore in revenue (1.55% of total) and carried a notional net worth of ₹21.96 crore per the disclosure.

Following these two transactions, per the 18 June announcement, the power division will no longer appear in segment reporting.
Two governance events rounded out the period: Company Secretary Seema Sharma resigned effective 7 April 2026, and Krupal Upadhyay was appointed in her place from 1 June 2026. Non-Executive Independent Director Ketan Shrimankar was re-appointed for a second two-year term from 11 August 2026, subject to shareholder approval.
3 — Business Model: WTF Do They Even Do?
Orient Ceratech manufactures things that other heavy industries consume and rarely think about — until they run out.
The core business is alumina refractories and monolithics: materials that line the insides of furnaces, kilns, and reactors so those furnaces don’t melt themselves. Steel plants are the primary customer. The product portfolio runs from calcined bauxite (the input) to fused aluminium oxide grains (the processed form) to low-cement castables (the finished article that gets poured into a furnace lining). If a steel plant runs hot, Orient Ceratech’s products are what stands between the steel and the structure.
The more interesting franchise is proppants — ceramic balls used in hydraulic fracturing to prop open shale rock formations and let natural gas flow out. Orient’s ALPHAPROP series (AHS10, AHS15) are intermediate and high-strength variants, manufactured with bauxite as the principal raw material. This segment contributes 20-25% of revenue, per CareEdge, and sits at the higher-margin end of the product mix.
The rest of the revenue mix, per CareEdge’s breakdown: calcined products, chamotte, and alumina-fused products at 10-15% each, with castables also at 20-25%. Chamotte — a refractory raw material — was acquired directly in FY2023 when OCL purchased the chamotte plant from group company Ashapura Minechem to eliminate job-work costs and manufacture in-house.
Read More about their products here – https://www.orientceratech.com/Fused-Based-Products.php: Orient Ceratech FY2026: Revenue Hits ₹405 Cr, PAT Doubles — While the Power Division Takes Its Final BowThe company holds captive bauxite mines at Bhatia, Jamnagar, and Bhuj in Gujarat, and a 9 MW captive thermal power plant at Porbandar (currently in the process of being sold). Manufacturing sits in Porbandar and Bhuj; the registered office is in Mumbai.
Geographically, exports contributed ~23% and domestic ~77% of revenue in FY2023 (the latest geographic split in the dump). The subsidiary Orient Advanced Materials FZE, incorporated in the Hamriyah Free Zone UAE in FY2023, had not yet commenced business as of the last reported status.
The business model, in summary: buy bauxite (partly from captive mines, partly from group entities, partly from the open market), process it at high temperature using captive power, and sell the output to steel plants and oil & gas drillers. Vertical integration that mostly works, interrupted occasionally by the working capital cycle’s appetite for financing.
Does the proppant franchise — catering to oil and gas fracturing demand — pull OCL’s fortune in a different direction than its steel-linked core?
4 — Financials Overview
Figures are standalone, in ₹ crore. The reporting period is Annual (full year ended 31 March 2026).
| Metric | FY2026 | FY2025 | YoY |
|---|---|---|---|
| Revenue | 405 | 333 | +22% |
| EBITDA* | 29.6 | 24.0 | +23% |
| PAT | 19.8 | 9.6 | +107% |
| EPS (₹) | 1.56 | 0.80 | +95% |
EBITDA computed as PBT (₹24.4 Cr) + Interest (₹3.3 Cr) + Depreciation (₹14.6 Cr) = ₹42.3 Cr. Note: Screener reports Operating Profit of ₹29.6 Cr (OPM 7.28%) which reflects the operating line before other income; EBITDA including other income and excluding exceptional is ₹42.3 Cr.
A note from the filing: the results include an exceptional item of ₹1.69 crore (standalone) — an incremental impact from the government’s new Labour Codes, recognised as a one-off per the board’s disclosure. FY2026 depreciation is higher than prior years partly due to a revised useful-life assessment for wind turbines, which added ₹3.38 crore of depreciation in the period, per the filing.
Quarterly (Mar 2026 vs Dec 2025)
| Metric | Mar 2026 | Dec 2025 | QoQ |
|---|---|---|---|
| Revenue | 95.2 | 94.5 | +0.7% |
| Operating Profit | 6.3 | 8.8 | -29% |
| PAT | 5.18 | 4.28 | +21% |
| EPS (₹) | 0.43 | 0.36 | +19% |
The quarterly PAT improvement despite a weaker operating line owes to ₹7.07 crore of other income in Mar 2026 versus ₹0.78 crore in Dec 2025 — a large swing that carries the period. The other income line was ₹13 crore for the full year.
EPS and P/E calculation: Full-year FY2026 standalone PAT = ₹19.8 crore. Shares outstanding = 119.65 crore (₹1 face value). Full-year EPS = ₹1.56. This is Q4/annual — no multiplication needed. At the data-sheet market cap of ₹493 crore on 119.65 crore shares, implied P/E = 26.3x (consistent with Screener’s stated 24.9x using market price at the time of data pull).
5 — Market Expectations & Historical Multiples
This section describes how the market is currently pricing the company and how that compares with its own history and peer group. It is descriptive, not predictive.
| Metric | Current | Historical Average | Peer Median |
|---|---|---|---|
| P/E | 24.9x | — | 36.4x |
| EV/EBITDA | 11.6x | — | — |
| P/B | 1.67x | — | — |
| ROE | 6.89% | 5% (3-yr avg) | — |
| ROCE | 9.16% | — | 13.2% |
Historical average P/E is not available in the dump and has been left blank rather than estimated.
The market currently pays 24.9x earnings here, against an industry P/E of 36.4x. The peer set — which includes Vesuvius India at 36x, HEG at 30x, and IFGL Refractories at 36x — collectively trades at a median roughly 46% above Orient Ceratech’s multiple.
The market appears to be pricing in the company’s moderate scale (₹405 crore in revenue against Vesuvius India’s ₹2,000 crore), the working capital intensity flagged by CareEdge (operating cycle of 184 days in FY2025, improving to ~165 days in FY2026 per data sheet), and the historical ROE profile — five-year average of 5%, against a sector that demands more. The proppant and castable segments, per CareEdge at 20-25% revenue contribution each, represent the higher-margin work the market would need to see grow materially for the multiple gap to narrow.
One factual observation on market expectations: the market currently prices Orient Ceratech at a discount to both the peer median and its own revenue-growth trajectory — the latter running at 22% in FY2026 against the five-year CAGR of 6%.
6 — What’s Cooking
A busy few months on the announcement front, and most of it involves the power division being shown the door.
Thermal power station sold (₹3.75 crore). The board approved the sale of the Porbandar thermal power station on 27 May 2026 to SS Fabrication, Ahmedabad. The unit had no separate revenue — it was captive — and was carried at a WDV of ₹3.77 crore per the filing. Agreement signed 9 June 2026; the disposal process is expected to take approximately six months from signing.
Windmills division sold (₹15.25 crore). On 18 June 2026, the board approved the sale of the windmill division to Greenwin Energy Thirteen LLP, Mumbai. The division contributed ₹6.27 crore in FY2026 revenue (1.55% of total). Per the filing, the power division will no longer appear in segment reporting after the transaction completes.
GIDC eviction notice. In October 2025, GIDC Porbandar issued an eviction order over alleged dues of ₹2.51 crore. The company disclosed the matter to exchanges on 16 October 2025 and stated its intent to appeal.
Income tax search. An income tax search was conducted at the registered office between 13-16 October 2025, with records seized and officials’ statements recorded. The company disclosed that operations were unaffected.

Manan Shah reappointed MD. Via postal ballot concluded 6 February 2026, shareholders approved the reappointment of Managing Director Manan Shah for a five-year term from 12 April 2026, with salary up to ₹87 lakh per annum plus 7.5% commission. The board he chairs approved the commission payment of 5% on net profits for FY2026.
7 — Balance Sheet
Standalone figures in ₹ crore.
| Item | Mar 2024 | Mar 2025 | Mar 2026 |
|---|---|---|---|
| Total Assets | 396 | 376 | 381 |
| Net Worth | 272 | 279 | 295 |
| Borrowings | 58 | 46 | 24 |
| Other Liabilities | 66 | 52 | 62 |
| Total Liabilities | 396 | 376 | 381 |
Balance sheet balances across all three columns. ✓
Three observations:
- Borrowings have spent the last two years quietly losing weight — ₹58 crore to ₹46 crore to ₹24 crore, a 59% reduction over two years. The company repaid ~₹10 crore of unsecured loans in 9MFY26, per CareEdge.
- Net worth has grown to ₹295 crore against total borrowings of ₹24 crore, a gearing ratio of 0.08x — with ample headroom to raise additional debt if the business requires it, per CareEdge.
- Other assets (trade receivables, inventory, other current assets) at ₹268 crore on the standalone sheet represent 70% of total assets — working capital intensity in visible form.
A balance sheet this clean almost invites the question: what is the ₹293 crore equity base actually earning?
8 — Cash Flow: Sab Number Game Hai
Standalone figures, ₹ crore.
| Year | Operating | Investing | Financing |
|---|---|---|---|
| FY2024 | -15 | -24 | +37 |
| FY2025 | +40 | -19 | -21 |
| FY2026 | +25 | -19* | -28 |
*Investing outflow in FY2026 is relatively modest at ₹19 crore, with capex of ₹3.2 crore — well below the ₹24 crore of FY2024 when the chamotte plant acquisition was underway. The large FY2024 financing inflow reflects external borrowings drawn for that capex, per CareEdge.
FY2026 financing outflows of ₹28 crore include repayment of ₹17 crore in working capital loans, ₹4.5 crore in term loan repayments, ₹3.4 crore in interest paid, and ₹3.1 crore in dividends. The company generated ₹25 crore in operating cash flow against ₹3.2 crore of capex — free cash flow of ₹26 crore per the data sheet.
The CFO/Operating Profit ratio stands at 110% for FY2026 — earnings are converting to cash at roughly full value. Two years ago, FY2024’s operating cash flow was negative (–₹15 crore), in the year of peak capex and working capital build. The normalisation since then is the cleaner story in this cash flow statement.
9 — Ratios: Sexy or Stressy?
| Ratio | Value |
|---|---|
| ROE | 6.89% |
| ROCE | 9.16% |
| P/E | 24.9x |
| PAT Margin | 4.9% |
| D/E | 0.08x |
ROE 6.89% — the equity base of ₹295 crore is generating returns that would not pass the ambition test. The three-year average of 5% confirms this isn’t just a single-year softness.
ROCE 9.16% — operating capital deployment is running at roughly the cost of that capital. CareEdge notes that a sizeable portion of fixed capital remains blocked in the thermal power plant and old manufacturing facility at Porbandar, per the filing — the division being sold — which has historically weighed on the ratio.
P/E 24.9x — the market pays nearly 25x for a business earning sub-7% ROE. The implicit bet sits in the proppant and castable segments, where CareEdge says margins are relatively higher.
PAT Margin 4.9% — thin, and includes ₹13 crore of other income. Operating profit margin (OPM) sits at 7.28% per the data sheet.
D/E 0.08x — structurally clean. The capital structure constraint is not leverage; it is return on the equity that exists.
10 — P&L Breakdown: Show Me the Money
Standalone figures, ₹ crore.
| Year | Revenue | EBITDA* | PAT |
|---|---|---|---|
| FY2024 | 317 | 36 | 17 |
| FY2025 | 333 | 34 | 10 |
| FY2026 | 405 | 42 | 20 |
*EBITDA = PBT + Interest + Depreciation for each year.
Revenue has grown from ₹317 crore to ₹405 crore over two years — a 28% cumulative increase — with the most recent year showing the sharpest acceleration (22% YoY). The five-year revenue CAGR is 6%, so FY2026 is running well above the long-run trend.
PAT halved from FY2024 to FY2025 before recovering sharply in FY2026. The FY2025 compression appears linked to elevated interest charges (₹7 crore in FY2025 versus ₹3 crore in FY2026 and FY2024) and higher depreciation from the newly acquired chamotte plant and capacity expansion. FY2026 sees both lines normalise.
The OPM has fluctuated in a narrow band: 9% in FY2024, 7% in FY2025, 7% in FY2026. The margin story is more stable than the PAT story — the volatility in net profit has been driven by below-the-line movements rather than gross economics.
11 — Peer Comparison
| Company | Revenue (Qtr, ₹ Cr) | PAT (Qtr, ₹ Cr) | P/E |
|---|---|---|---|
| Graphite India | 816 | -105 | 67x |
| HEG | 603 | -114 | 30x |
| Vesuvius India | 500 | 56 | 36x |
| RHI Magnesita | 786 | -624 | 62x |
| Raghav Productivity | 71 | 15 | 103x |
| Monolithisch Industries | 41 | 8 | 70x |
| IFGL Refractories | 483 | 14 | 36x |
| Orient Ceratech | 95 | 5 | 25x |
| Peer Median | 83 | 5 | 36x |
Orient Ceratech sits at the lower end of the market capitalisation range (₹493 crore) and trades at a P/E of 25x — the lowest of the named peers and 30% below the peer median of 36x. By quarterly revenue, it is comparable in size to Monolithisch Industries but operates at a lower multiple.
Several larger peers — Graphite India, HEG, RHI Magnesita — are loss-making at the quarterly level, dragged by sector cyclicality in electrodes and refractories. Vesuvius India at 36x earns a 36x multiple on a ROCE of 21%, roughly double OCL’s. Raghav Productivity at 103x commands the widest premium in the peer set, at 30% ROCE.
The multiple-to-return relationship in this peer group is legible: the market pays more for demonstrated capital efficiency. At 9% ROCE and 25x earnings, OCL sits in the segment where the market appears to be discounting current return metrics while pricing for some recovery.
12 — Miscellaneous: Shareholding & Promoters
| Holder | % |
|---|---|
| Promoters | 63.90% |
| FIIs | 13.32% |
| Public | 22.78% |
Promoter structure: The Ashapura Group controls OCL through interlocking entities. Bombay Minerals Limited (BML), the main promoter, held 31.76% as recently as Jun 2023 but has reduced its direct stake to 23.72% by Mar 2026 — a 8-percentage-point trim over the period, though total promoter holding remained flat at 63.9% as Ashapura International Limited stepped up its stake to 8.35% from near-zero. The overall promoter holding has not changed but the internal plumbing has been reshuffled.
Manan Shah (DIN: 06378095), Managing Director, holds 5.70% personally. Chetan Navnitlal Shah holds 2.16%. The Shah family’s combined stake forms the personal layer of the promoter constellation. Manan Shah has been reappointed MD for five years from April 2026 at up to ₹87 lakh per annum plus commission — approved by 96.39% of shareholders via postal ballot, per the filing. The board he chairs approved his 5% commission on FY2026 net profits.
FII holding of 13.32% is stable and has barely budged for two years. Legends Global Opportunities (Singapore) holds 8.75%, the dominant foreign holder. The Investor Education and Protection Fund holds 3.07% of public float — unclaimed shares that have migrated to the government authority, a number worth noting in a 26,000-shareholder company.
The Ashapura Group’s parent entities, BML and Ashapura International, have a weak credit profile separately from OCL, per CareEdge — a risk the rating agency monitors.
13 — Corporate Governance: Angels or Devils?
The statutory auditors are Sanghavi & Company (FRN: 109099W), who issued unmodified opinions on both standalone and consolidated FY2026 results. The audit report is standard-form with no emphasis-of-matter paragraphs beyond the Labour Codes exceptional item disclosure.
The governance record for FY2026 contains two events that merit factual note. An income tax search was conducted at the registered office from 13-16 October 2025, with records seized and official statements recorded; the company disclosed on 16 October 2025 that operations were unaffected and made no further material disclosure on the matter. A GIDC Porbandar eviction notice was issued in October 2025 over alleged dues of ₹2.51 crore; the company stated its intent to appeal.
Pledged promoter shareholding: 0.00%. This is a clean figure for a group company.
The departure of Company Secretary Seema Sharma in April 2026, replaced by Krupal Upadhyay from 1 June 2026, was disclosed in the ordinary course. Independent Director Ketan Shrimankar — a CA with 35 years of experience and current fund manager with a SEBI-registered Cat III fund — is being re-appointed for a second term.
CareEdge flags the weak credit profile of group entities (BML and Ashapura International) as an ongoing watch item — no material support extended to date, per the filing, but monitored.
14 — Industry Roast & Macro Context
The refractory and abrasives industry has a gift for combining unglamorous products with structurally important end-markets. Nobody makes a documentary about furnace lining. But when steel output contracts — as it does whenever infrastructure spending cools, auto demand softens, or China dumps — the demand for the stuff that lines furnaces goes quiet in short order.
OCL’s exposure is diversified across steel (refractories, monolithics), oil & gas (proppants), and abrasives (fused alumina grains) — a more varied demand base than pure-play electrode makers. This is why OCL is posting small profits while several peers are posting large losses in the current quarterly period.
The proppant sub-segment is peculiar: it serves hydraulic fracturing demand in deep shale formations, a market driven by US gas prices and Indian oil sector capex — neither of which has obvious correlation to Gujarat’s industrial activity. It is also the segment where, per CareEdge, OCL recently completed a ₹25 crore capacity expansion expected to double one top-four product line’s installed capacity. That expansion is currently on trial run.
The power division’s exit is the strategic subtext to FY2026. A company that operated coal and furnace-oil generation — both polluting, both expensive — is tidying up the asset base. The windmill sale to Greenwin Energy and the thermal station sale to SS Fabrication, totalling ₹19 crore, are not transformative numbers but they are directional: OCL becomes a purer ceramics and abrasives business. Which, as rebranding from “Abrasives” to “Ceratech” in 2023 telegraphed, was the plan.
The macro question that hangs over the sector: Indian infrastructure capex drives steel demand, steel demand drives refractory consumption. If the capex cycle stays elevated, OCL’s capacity additions arrive at the right moment. If it turns, the working capital cycle — 165 days and historically up to 223 days — becomes the problem.
15 — EduInvesting Verdict
SWOT
| Strengths | Weaknesses |
|---|---|
| Clean balance sheet; D/E 0.08x | ROCE 9.16% against a peer median of 13.2% |
| Diversified product mix across steel, oil & gas, abrasives | Five-year revenue CAGR of 6% — growth has historically been slow |
| Captive bauxite mines and power (partially retained) | Working capital cycle of 165 days; historically up to 223 days |
| CareEdge BBB+; Stable reaffirmation; 8.10x interest coverage | Other income (₹13 Cr) is a meaningful share of PAT (₹19.8 Cr) |
| Opportunities | Threats |
|---|---|
| Proppant/castable capacity expansion on trial run; could lift higher-margin product revenue | Group entity credit weakness (BML, Ashapura International); CareEdge monitor |
| Power division exit simplifies the business and frees blocked capital | IT search (Oct 2025); GIDC eviction dispute — both unresolved at time of results |
| Exports at ~23% of revenue with a UAE subsidiary yet to commence business | Cyclical end-user industries: steel, cement, oil & gas |
A ₹295 crore equity base, borrowings down to ₹24 crore, and PAT doubling in a year — the balance sheet is doing its part. The question the multiples leave open is whether 9% ROCE and 7% OPM, in a business selling to furnace operators and frackers, is the floor or the trend.