1. At a Glance
A Mumbai-based luxury real estate giant that delivers more margin per square foot than your local street food vendor earns per samosa. Oberoi Realty has dropped its Q1 FY26 results, showing Rs. 421 Cr in profit on Rs. 1,074 Cr revenue. Still fancy that 2BHK in Goregaon?
2. Introduction with Hook
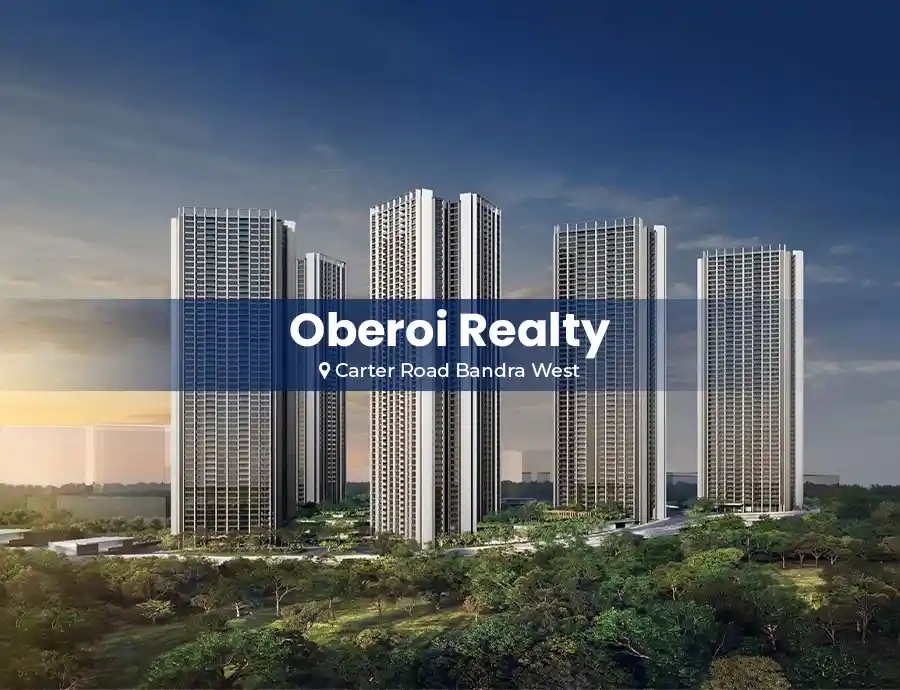
Imagine if Armani tailored buildings. That’s Oberoi Realty.
While others sell real estate, these folks sell aspiration — and floor-to-ceiling glass walls.
- Q1 FY26 Net Profit: ₹421 Cr
- OPM: 53% (higher than your gym attendance rate)
After 50 completed projects and 161 lakh sq. ft. across Mumbai’s glitziest pin codes, Oberoi doesn’t just build properties, they build status.
3. Business Model (WTF Do They Even Do?)
Oberoi Realty operates in:
- Residential (Main moneymaker)
- Commercial Offices
- Retail (Malls)
- Hospitality (The Westin, etc.)
- Social Infrastructure (Schools, etc.)
Core = Residential.
Luxury towers like Oberoi Exquisite, Sky City, and Elysian are designed to make NRIs homesick and domestic buyers broke.
Revenue Mix FY25:
- 96% Real Estate
- 4% everything else (hospitality, retail, etc.)
4. Financials Overview
Q1 FY26
- Revenue: ₹1,074 Cr
- Net Profit: ₹421 Cr
- OPM: 53%
- EPS: ₹11.59
- ROCE: 17.7%
- ROE: 14.7%
FY25 (Full Year)
- Revenue: ₹5,286 Cr
- Net Profit: ₹2,226 Cr
- OPM: 59%
- EPS: ₹61.2
They make ₹3 out of every ₹5 as profit before taxes. Your startup can’t relate.
5. Valuation
Let’s play real estate roulette.
Current Market Cap: ₹66,700 Cr
Trailing EPS: ₹61.2
P/E: ~32.4
Fair Value Range Estimate:
- DCF / Sum-of-parts / Peer Avg.
- FV Range = ₹1,600–₹2,100
Why range? Because real estate prices change faster than Bollywood casting calls.
6. What’s Cooking – News, Triggers, Drama
- Q1 FY26 dividend announced: ₹2/share (interim)
- New launches expected in Borivali, Goregaon, and possibly heaven (if they get permissions)
- Q-o-Q dip in revenue due to phasing, not panic
- Inventory absorption strong, indicating demand still hot despite interest rates
The CEO in the concall: “We’re not chasing volume, we’re chasing value.” Savage.
7. Balance Sheet
| Metrics | Mar 2025 |
|---|---|
| Equity | ₹364 Cr |
| Reserves | ₹15,341 Cr |
| Borrowings | ₹3,300 Cr |
| Total Assets | ₹22,715 Cr |
| Investments | ₹2,535 Cr |
| CWIP | ₹1,604 Cr |
Key Points:
- Minimal debt for a realty player = Flex
- Massive cash + investments = optionality for land grab when peers panic
8. Cash Flow – Sab Number Game Hai
| Year | CFO | CFI | CFF | Net Cash |
|---|---|---|---|---|
| FY25 | ₹2,163 Cr | ₹-2,392 Cr | ₹200 Cr | ₹-29 Cr |
| FY24 | ₹2,816 Cr | ₹-644 Cr | ₹-2,034 Cr | ₹138 Cr |
Takeaways:
- Aggressive investment in new projects
- Healthy operating cash flow
- Financing stable — no panic borrowing
9. Ratios – Sexy or Stressy?
| Metric | FY25 |
|---|---|
| ROCE | 18% |
| ROE | 15% |
| OPM | 59% |
| D/E Ratio | 0.21 |
| Debtor Days | 8 |
| Working Capital Days | 624 |
Verdict: Sexy.
You don’t see many realty companies with single-digit debtor days and 59% OPM. This is as clean as it gets in this sector.
10. P&L Breakdown – Show Me the Money
| Year | Sales | Expenses | Op Profit | Net Profit |
|---|---|---|---|---|
| FY25 | ₹5,286 Cr | ₹2,183 Cr | ₹3,103 Cr | ₹2,226 Cr |
| FY24 | ₹4,496 Cr | ₹2,066 Cr | ₹2,430 Cr | ₹1,927 Cr |
| FY23 | ₹4,193 Cr | ₹2,081 Cr | ₹2,112 Cr | ₹1,905 Cr |
- Consistent top-line and bottom-line growth
- Net margins: Over 40%. Better than most SaaS companies.
11. Peer Comparison
| Company | Rev (TTM) Cr | PAT (TTM) Cr | ROCE % | OPM % | P/E | Mcap Cr |
|---|---|---|---|---|---|---|
| DLF | ₹7,993 | ₹4,657 | 6.5% | 26.4% | 45.3 | ₹2,11,145 |
| Lodha | ₹13,779 | ₹2,764 | 15.6% | 28.9% | 52.3 | ₹1,44,652 |
| Godrej Prop | ₹4,923 | ₹1,216 | 6.6% | -1.5% | 59.6 | ₹72,463 |
| Prestige | ₹7,349 | ₹468 | 7.7% | 34.2% | 166.4 | ₹77,789 |
| Oberoi | ₹4,869 | ₹2,062 | 17.7% | 57.6% | 32.4 | ₹66,706 |
TL;DR: Highest margins. Lowest P/E among quality players.
12. Miscellaneous – Shareholding, Promoters
| Shareholder | % Holding (Jun 2025) |
|---|---|
| Promoters | 67.71% |
| FIIs | 19.36% |
| DIIs | 10.80% |
| Public | 2.14% |
- Promoter holding = rock solid
- FIIs increasing stake = they know something
- Retail = still sleeping
Also:
- No equity dilution in a decade
- Declared dividend = ₹2 interim = ~0.44% yield
13. EduInvesting Verdict™
If Mumbai’s skyline had a face, it would be designed by Oberoi Realty.
While other builders fight over discounts and RERA delays, Oberoi plays the long game: luxury, premium, and low-leverage. They don’t build homes, they build legacies — and margins.
As an investor: If you like quality, visibility, and profitability without drama, this is your guy.
As a buyer: Better start saving. Your EMI won’t include OPM.
Metadata
– Written by Eduinvesting Team | 21 July 2025
– Tags: Oberoi Realty, Real Estate, Q1 FY26, Mumbai, Luxury Housing, Dividend


